Plotting Subsets of Data
Example: Set Marker Attributes for Each BY Group
This example illustrates the fact that observation properties (such as the color and shape of markers) are copied to each BY group during the subsetting of the data. One way to visualize the location in which tropical cyclones originate is to mark the origin of each storm with a special symbol.
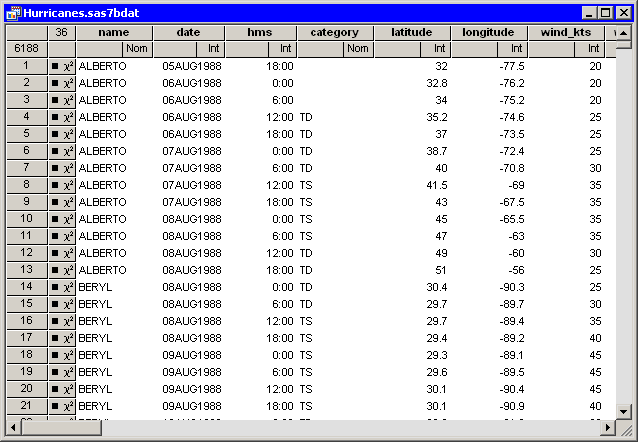
Figure 12.7 shows the first few observations of the Hurricanes data set. Observations 1–13 correspond to a time series for Tropical Storm Alberto. Observations 14–25 correspond to Beryl.
Observations 26–63 correspond to Chris, and so on. The values of the latitude and longitude variables for observations 1, 14, 26, 64, …, are the origins of the cyclones. It would be useful to mark these observations
so that they are noticeable in the BY-group plots.
Figure 12.7: Hurricane Data
This example has three parts. The first part creates an indicator variable that enumerates the observations for each cyclone. In particular, an observation for which the indicator variable is '1' represents the origin of the storm. The second part of the example assigns a special marker property to the origins. The third part creates plots of BY group, as in the previous example.