Exploring Data in One Dimension
Example: Change the Positions of Histograms Bins
By default, SAS/IML Studio produces histograms with an anchor location and bin width chosen according to an algorithm by Terrell
and Scott (1985).
This section describes how you can choose a different anchor location or bin width for a histogram. The example in this section
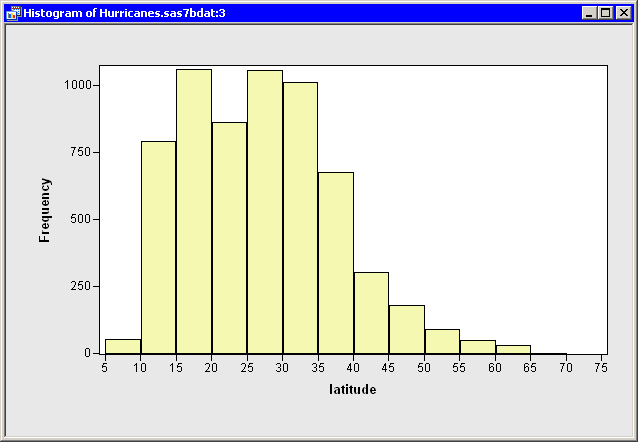
is a continuation of the example in Example: Create a Histogram, in which you created a histogram of the latitude variable in the Hurricanes data set.
For a histogram, the major tick unit is also the width of the histogram bins. For example, the tick marks for the histogram in Figure 5.7 are anchored at 6.25 and have a tick unit of 2.5. You can change the location of the histogram ticks so that the bins show the frequency of observations in the intervals 5–10, 10–15, 15–20, and so on.
To change the location of the histogram ticks:
-
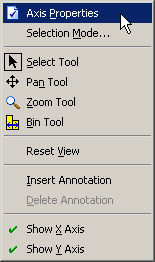
Right-click anywhere on the horizontal axis of the histogram, and select from the pop-up menu, as shown in Figure 5.9.
Figure 5.9: The Axis Pop-up Menu
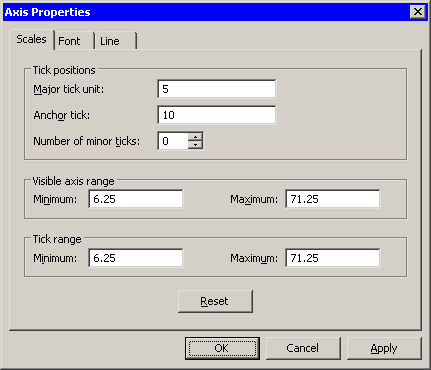
The Axis Properties dialog box appears as in Figure 5.10. This is a quick way to determine the anchor location, tick unit, and tick range for an axis.
-
Change the Major tick unit value to
5. -
Change the Anchor tick value to
10.Figure 5.10: Dialog Box for Specifying Histogram Bins
-
Click .
The histogram updates to reflect the new histogram bin locations. The revised histogram is shown in Figure 5.11. The Tick Range field shown in Figure 5.10 is automatically widened, if necessary, so that all data are contained in bins.
Figure 5.11: Histogram with Customized Bins