Getting Started with SAS/IML Studio
Create a Box Plot
The data set contains several variables that measure the size of a tropical cyclone. One of these is the radius_eye variable, which contains the radius of a cyclone’s eye in nautical miles. (The eye of a cyclone is a calm, relatively cloudless
central region.) The radius_eye variable has many missing values, because not all storms have well-defined eyes.
The following steps create a box plot that shows how the radius of a cyclone’s eye varies with the Saffir-Simpson category. The figures in this section assume that you have excluded observations with low wind speeds as described in the section Exclude Observations.
-
Select → from the main menu.
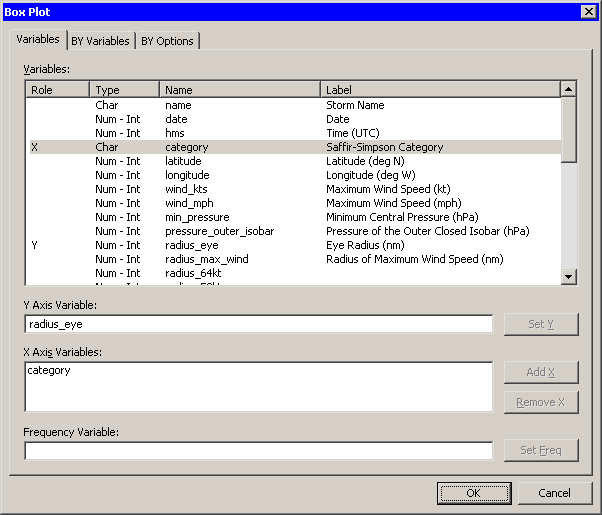
The Box Plot dialog box appears. (See Figure 2.11.)
Figure 2.11: Box Plot Dialog Box
-
Select the variable
radius_eye, and click . -
Select the variable
category, and click . -
Click .
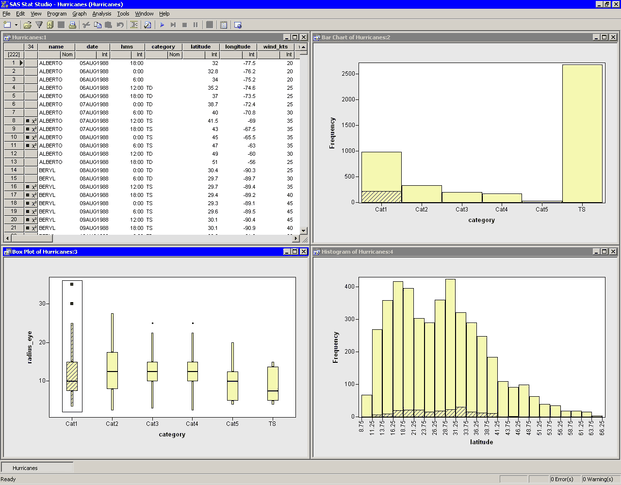
A box plot appears as in Figure 2.12. Move the box plot so that it does not cover the data table or other plots.
The box plot summarizes the distribution of eye radii for each Saffir-Simpson category. The plot indicates that the median eye radius tends to increase with storm intensity for tropical storms, category 1, and category 2 hurricanes. Category 2–4 storms have similar distributions, while the most intense hurricanes (category 5) in this data set tend to have eyes that are small and compact. The box plot also indicates considerable spread in the radii of eyes.
Recall that the
radius_eyevariable contains many missing values. These missing values are not displayed by the box plot. You might wonder what percentage of all storms of a given Saffir-Simpson intensity have well-defined eyes. You can determine this percentage by selecting all observations in one of the box plots and noting the proportion of observations that are selected in the bar chart. -
Draw a selection rectangle in the box plot around the category 1 storms.
In the bar chart in Figure 2.12, note that approximately 25% of the bar for category 1 storms is displayed as selected, which means that approximately one quarter of the category 1 storms in this data set have nonmissing measurements for
radius_eye.Figure 2.12: Proportion of Category 1 Storms with Well-Defined Eyes
-
Drag the selection rectangle to select eye radii in other categories.
The selected observations displayed in the bar chart reveal the proportion of storms in each Saffir-Simpson category that have nonmissing values for
radius_eye. Note in particular that very few tropical storms have eyes, whereas almost all category 4 and 5 storms have well-defined eyes. -
Click outside the plot area in any plot to deselect all observations.