Distribution Analysis: Frequency Counts
Example: Display Frequency Counts
In this example, you create a one-way frequency table for the category variable of the Hurricanes data set. The Hurricanes data set contains 6,188 observations of tropical cyclones in the Atlantic basin. The category variable gives the Saffir-Simpson category of the tropical cyclone for each observation. A missing value of the category variable means that the storm had an intensity of less than tropical depression strength (wind speeds less than 22 knots)
at the time of observation.
To create a one-way frequency table:
-
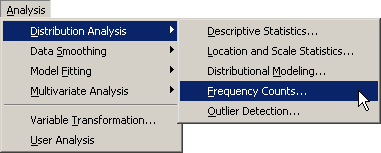
Select → → from the main menu, as shown in Figure 16.1.
Figure 16.1: Selecting the Frequency Counts Analysis
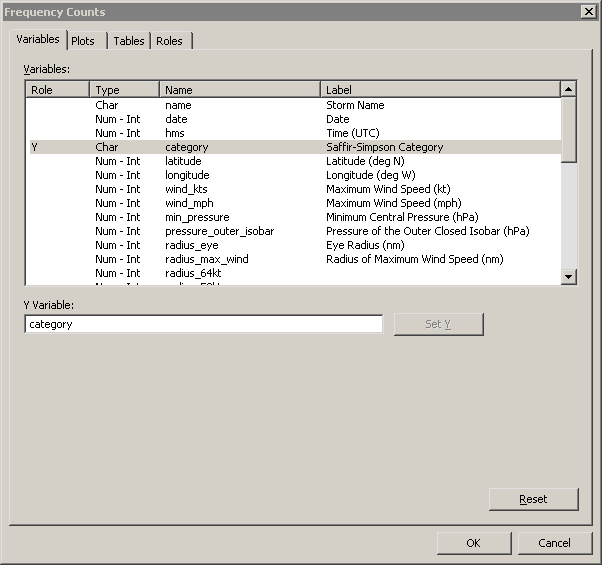
The Frequency Counts dialog box appears. (See Figure 16.2.) You can select a variable for the analysis on the Variables tab.
-
Select the variable
category, and click .Figure 16.2: Specifying a Variable
For nominal variables, you can produce a bar chart of the categories of the chosen variable.
-
Click the Plots tab.
The Plots tab becomes active. (See Figure 16.3.)
-
Select .
-
Click .
Figure 16.3: Selecting Plots
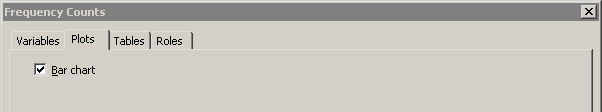
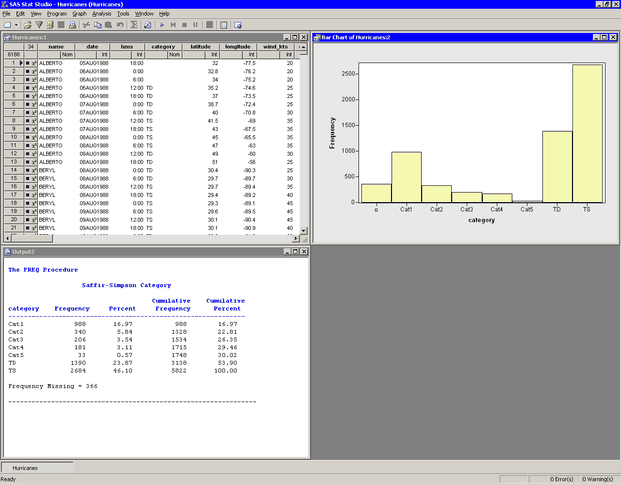
Figure 16.4 shows the results of this analysis. The analysis calls the FREQ procedure, which uses the options specified in the dialog box. The procedure displays a frequency table in the output document. The table shows the frequency and percent of each Saffir-Simpson category for these data. Hurricanes of category 3 or higher account for only 7% of the nonmissing data, whereas almost half of the observations are classified as tropical storms.
Figure 16.4: Output from a Frequency Counts Analysis
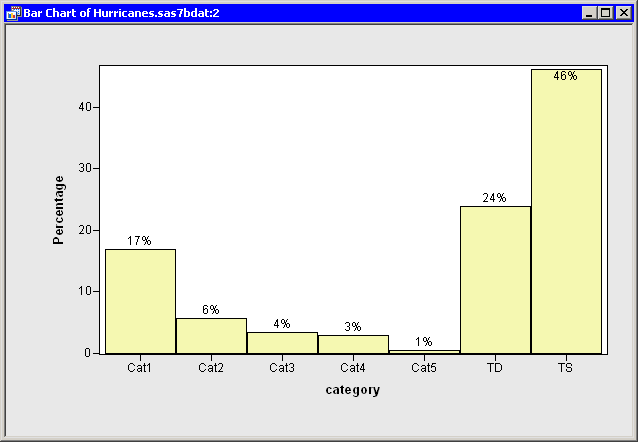
The bar chart shows a graphical view of thecategoryvariable. You can create a graphical version of the output table by labeling the bars in the bar chart with their frequencies or percentages. To add labels to the bar chart, do the following: -
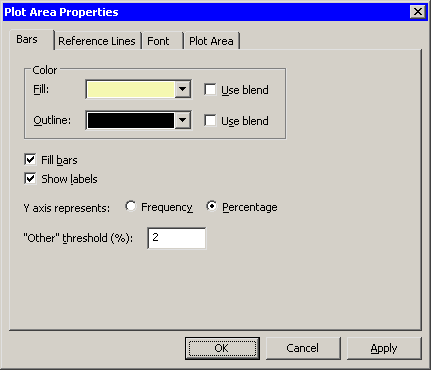
Right-click near the center of the plot area. Select from the pop-up menu.
The Plot Area Properties dialog box appears. (See Figure 16.5.) The Bars tab controls attributes of the bar chart.
-
Click .
-
Click .
-
Click .
Note: You can also label the bar chart by using keyboard shortcuts. Activate the bar chart. Press the "l" key (lowercase "L") to toggle labels. Press the "p" key to alternate between displaying frequency and percentage.
Figure 16.5: Bar Chart Properties
The percentages displayed on the bar chart do not match the percentages in the one-way frequency table. That is because the bar chart includes the 366 missing observations in the total number of observations, whereas the analysis does not include those observations by default. (The counts for each bar do match the counts in the table; only the percentages differ.)
To exclude missing values from the bar chart:
-
Select the missing observations by clicking the first bar in the bar chart.
-
Select the data table to make it the active window.
-
Select → →.
The bar chart now omits the missing values as shown in Figure 16.6.
Figure 16.6: The Bar Chart without Missing Values
Alternatively, if you want to include missing values as a valid category, then you can specify that the one-way table should include a category of missing values.
To specify options for the Frequency Counts analysis:
-
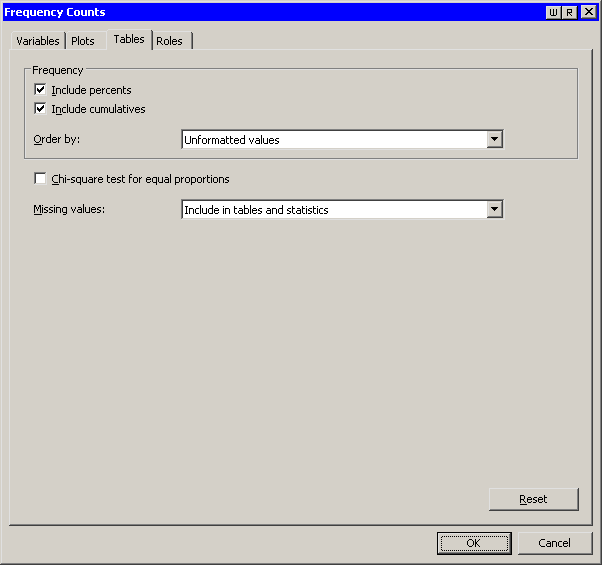
Click the Tables tab, as shown in Figure 16.7.
-
In the list, select the option .
This option specifies that missing values should be regarded as a valid category. If you run (or rerun) the analysis with this option, the one-way table includes missing values as a valid category. The frequency table produced with this option agrees with the default bar chart.
Figure 16.7: The Tables Tab