Model Fitting: Linear Regression
Plots Tab
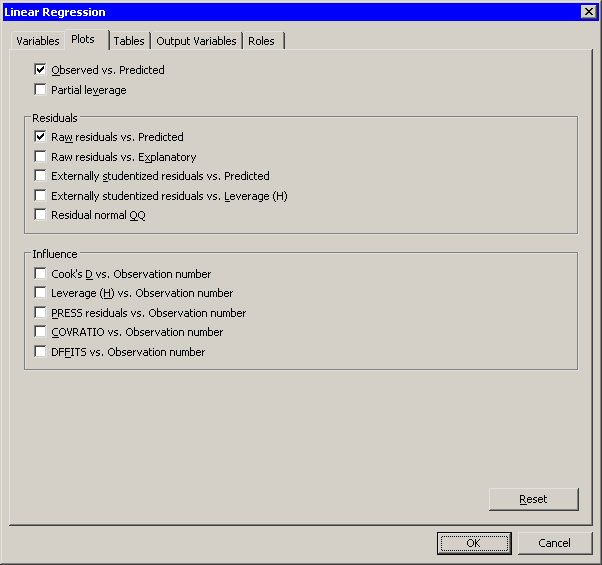
You can use the Plots tab to create plots that graphically display results of the analysis. (See Figure 21.15.) There are plots that help you to visualize the fit, the residuals, and various influence diagnostics.
Creating a plot often adds one or more variables to the data table. The following plots are available:
- Observed vs. Predicted
-
creates a scatter plot of the Y variables versus the predicted values, overlaid with the diagonal line that represents a perfect fit. - Partial leverage
-
creates a partial leverage plot for each regressor and for the intercept. A line in the plot has a slope equal to the parameter estimate in the full model. Confidence limits for each regressor are related to the confidence limits for parameter estimates. - Raw residuals vs. Predicted
-
creates a scatter plot of the residuals versus the predicted values. - Raw residuals vs. Explanatory
-
creates scatter plots of the residuals versus the X variables. - Externally studentized residuals vs. Predicted
-
creates a scatter plot of the studentized residuals versus the predicted value. - Externally studentized residuals vs. Leverage (H)
-
creates a scatter plot of the studentized residuals versus the leverage statistic. - Residual normal QQ
- Cook’s D vs. Observation number
-
creates a scatter plot of Cook’s D statistic for each observation. - Leverage (H) vs. Observation number
-
creates a scatter plot of the leverage statistic for each observation. - PRESS residuals vs. Observation number
-
creates a scatter plot of the PRESS residual for each observation. - COVRATIO vs. Observation number
-
creates a scatter plot of the covariance ratio for each observation. - DFFITS vs. Observation number
-
creates a scatter plot of the DFFIT statistic for each observation.
Figure 21.15: The Plots Tab