Distribution Analysis: Distributional Modeling
Example: Specify Multiple Density Curves
You can overlay two (or more) density curves on a single histogram. The curves can be different distributions from the same family or distributions from different families.
In this section, you fit a lognormal distribution and a Weibull distribution to data in the radius_eye variable. The radius_eye variable gives the radius of a cyclone’s eye (if an eye exists), in nautical miles. (The eye of a cyclone is a calm, relatively
cloudless central region.)
Note: There are often scientific or engineering considerations that lead to the choice of either a lognormal or a Weibull model. This example does not have a scientific basis; it merely illustrates how you can add multiple curves to a histogram.
To fit parametric distributions to the data:
-
Select → → from the main menu.
-
Select the variable
radius_eye, and click . -
Click the Estimators tab.
The normal distribution appears in the list. The next step changes this item to a lognormal distribution.
-
Select the first item ("Normal") in the list. Select from the list, as shown in Figure 15.8.
Figure 15.8: Selecting a Lognormal Distribution
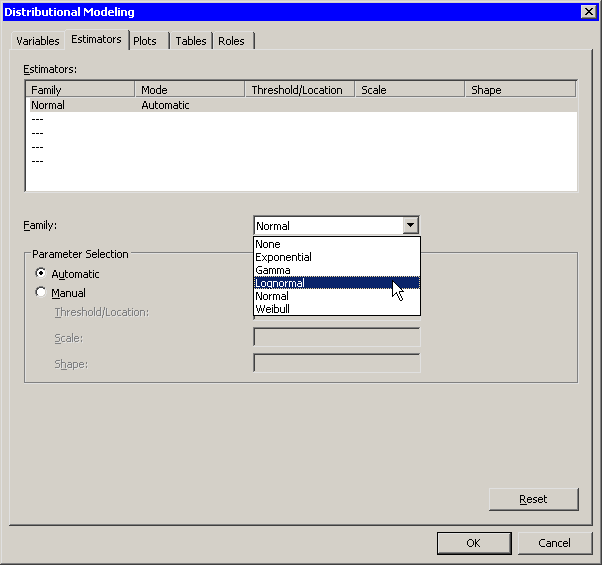
The lognormal distribution has three parameters. By default, the thresholdparameter is set to zero, and the scale and shape parameters are estimated by maximum likelihood.
The next two steps add a Weibull distribution to the list.
-
Select the second item (a dashed line) in the list.
-
Select from the list.
Figure 15.9: Selecting Multiple Distributions
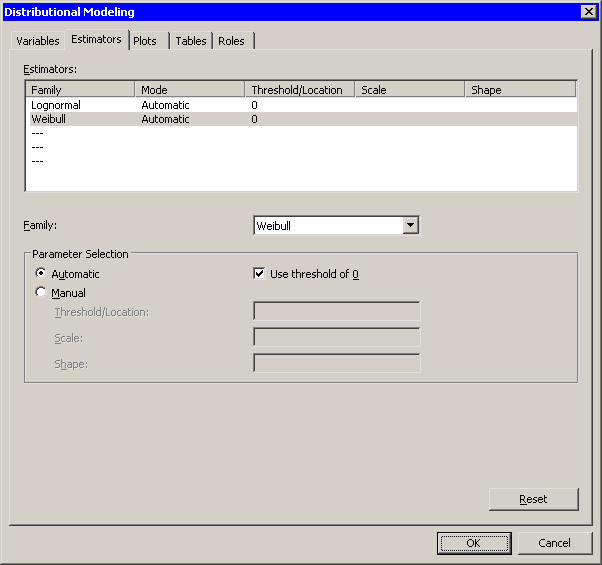
The Weibull distribution also has three parameters. Again, the threshold parameter defaults to zero, whereas the other parameters are estimated by maximum likelihood. Accept these defaults, as shown in Figure 15.9.
-
Click .
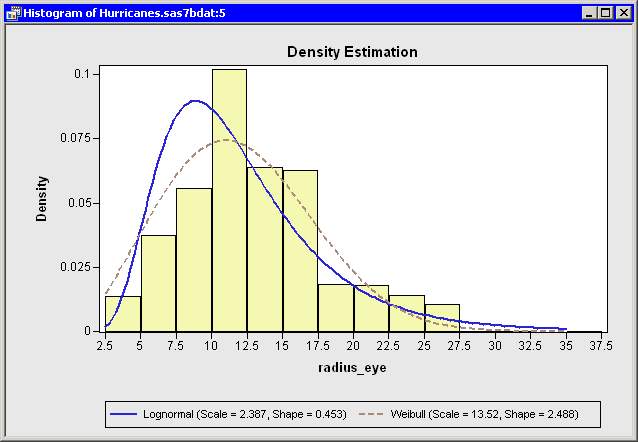
Two density curves are added to the histogram, as shown in Figure 15.10. If these were competing scientific models, you could analyze and compare the merits of the models.
Figure 15.10: Multiple Density Curves