Interacting with the Data Table
Changing Observation Labels
You can change the label displayed in the left-most column of the data table. Observation numbers are shown by default.
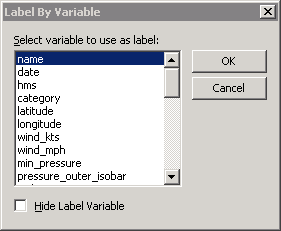
You can select → → from the main menu to open the Label by Variable dialog box. (See Figure 4.9.) You can use this dialog box to select the variable whose values are displayed in the left-most column of the data table. The variable is also set as the default label that is displayed when you click an observation marker in a graph.
Figure 4.9: The Label by Variable Dialog Box

The check box hides the label variable. This is especially useful if the label variable is one of the first variables in the data table.