Plotting Subsets of Data
When your data contain categorical variables, you might be interested in comparing subsets of data that are defined by values of those variables. For example, if your data contains a gender variable, you might want to compare the characteristics of males with those of females.
In SAS/IML Studio you can create plots of subsets of data that are defined by values of one or more categorical variables. The variables whose values define the subsets are called BY variables in SAS, and the subsets are known as BY groups. The BY groups are, by definition, mutually disjoint. Consequently, these plots are not dynamically linked to each other. In SAS/IML Studio, these plots are also not linked to the original data.
When you select any graph from the main menu, a dialog box appears that has multiple tabs. (See Figure 12.1.) You can use the Variables tab to define the variable used by the plot. If you click , the plot is created on the full data and is linked to other plots and views of that data.
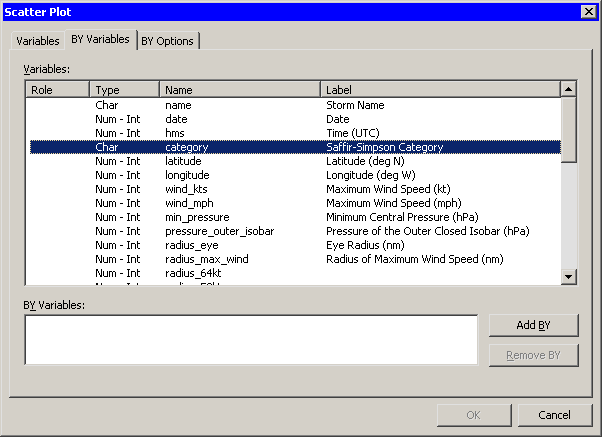
Alternatively, you can click the BY Variables tab and define one or more BY variables. (See Figure 12.1.) When you click , the data are split into BY groups, and a plot is created for each BY group. (The BY variables are usually nominal variables.)
You can specify options for the BY-group plots on the BY Options tab.