Getting Started with SAS/IML Studio
In this section you create a histogram of the latitude variable and examine relationships between the category and latitude variables. The figures in this section assume that you have excluded observations with low wind speeds as described in the
section Exclude Observations.
To create a histogram:
-
Select → from the main menu.
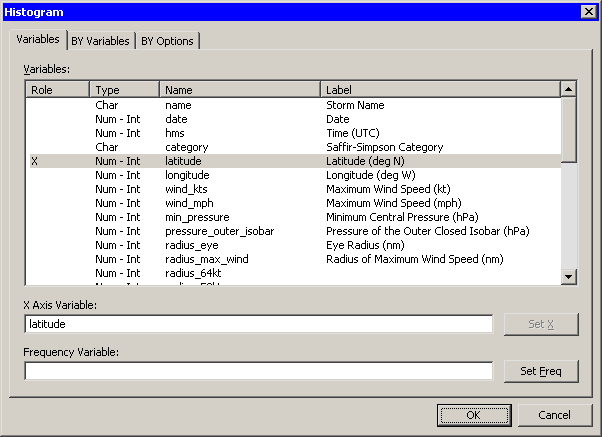
The Histogram dialog box appears. (See Figure 2.7.)
-
Select the variable
latitude, and click . -
Click .
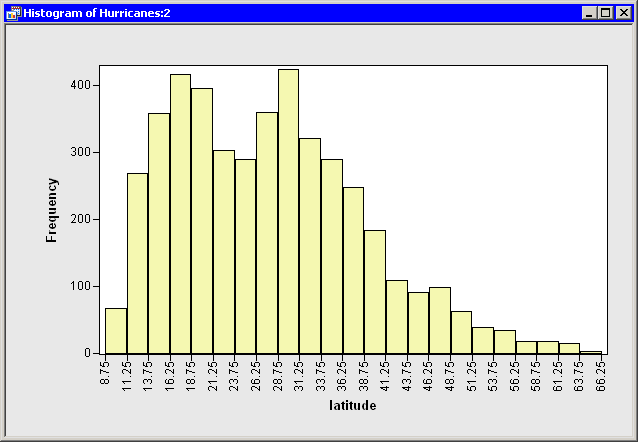
A histogram (Figure 2.8) appears, which shows the distribution of the
latitudevariable for the storms that are included in the plots. Move the histogram so that it does not cover the bar chart or data table.You have seen that you can select observations in a plot by clicking bars or observation markers. You can also select observations by drawing a selection rectangle. To draw a selection rectangle, click in a graph and hold down the left mouse button while you move the mouse pointer to a new location.
-
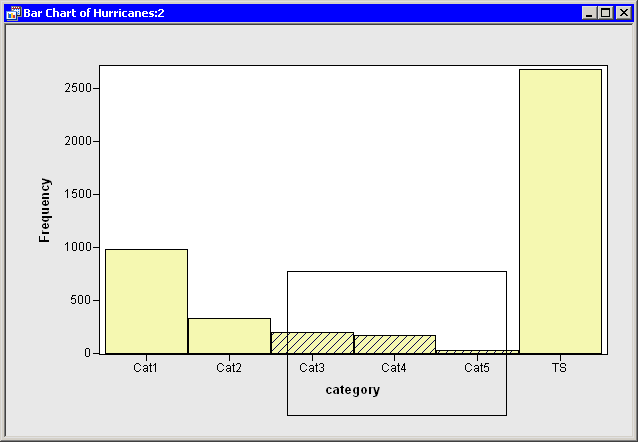
Draw a selection rectangle in the bar chart to select all storms of category 3, 4, and 5.
The bar chart looks like the one in Figure 2.9.
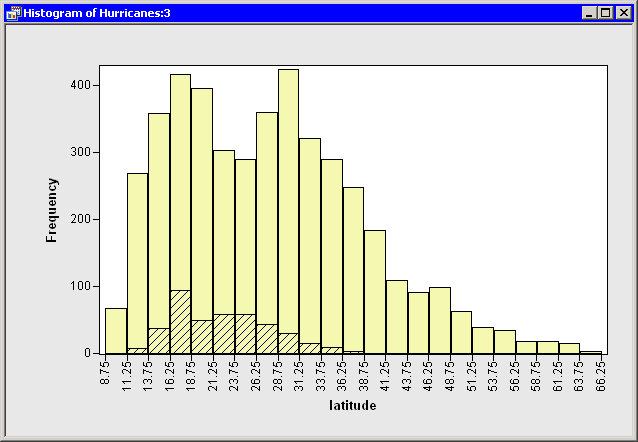
Note that these selected observations are also shown in the histogram in Figure 2.10. The histogram shows the conditional distribution of
latitude, given that a storm is greater than or equal to category 3 intensity. The conditional distribution shows that very strong hurricanes tend to occur between 11 and 37 degrees north latitude, with a median latitude of about 22 degrees. If these data are representative of all Atlantic hurricanes, you might conjecture that it would be relatively rare for a category 3 hurricane to strike north of the North Carolina-Virginia border (roughly north latitude).