Getting Started with SAS/IML Studio
This chapter analyzes the Hurricanes data set, which is distributed with SAS/IML Studio.
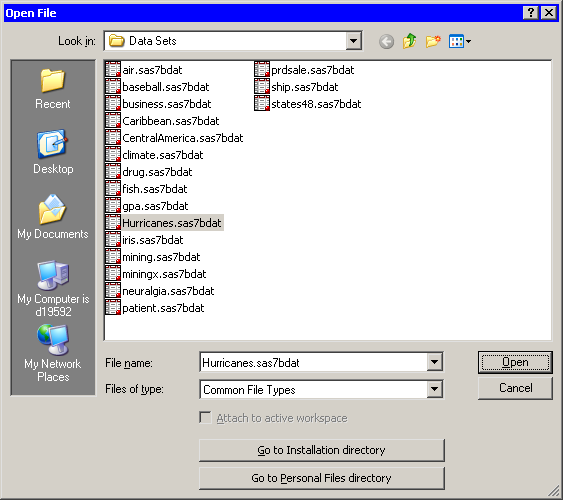
To use the GUI to open the data set:
-
Select → → from the main menu. The Open File dialog box appears. (See Figure 2.1.)
-
Click near the bottom of the dialog box.
-
Double-click the
Data Setsfolder. -
Select the
Hurricanes.sas7bdatfile. -
Click .
The data table in Figure 2.2 appears.
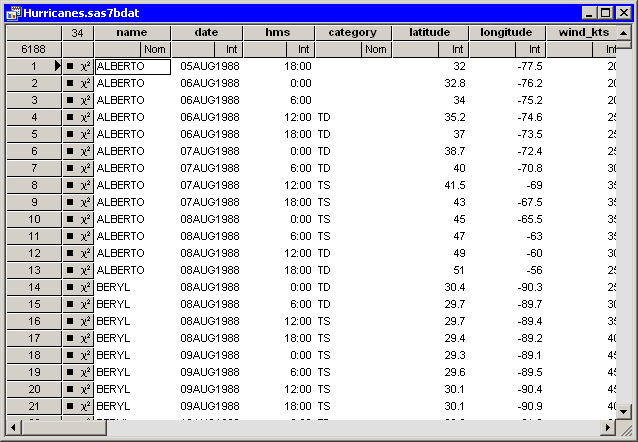
The row heading of the data table includes two special cells for each observation: one that shows the location of the observation
in the data set, and the other that shows the status of the observation in analyses and plots. The status of each observation
is indicated by the presence or absence of a marker and a ![]() symbol. The presence of a marker (by default, a filled square) indicates that the observation is included in plots; observations
that are excluded from plots do not display a marker. Similarly, the
symbol. The presence of a marker (by default, a filled square) indicates that the observation is included in plots; observations
that are excluded from plots do not display a marker. Similarly, the ![]() symbol indicates that the observation is included in analyses. The
symbol indicates that the observation is included in analyses. The Hurricanes data initially has all observations included in plots and analyses. See Chapter 4: Interacting with the Data Table, for more information about the data table symbols.