Interacting with the Data Table
You can choose which observations appear in plots and which are used in analyses.
To include or exclude observations, first select the observations. From the → menu, you can then select , , , or .
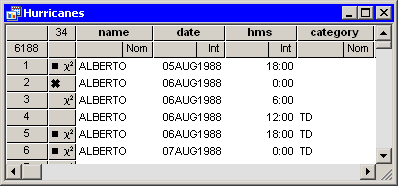
The row heading of the data table shows the status of an observation in analyses and plots. A marker symbol indicates that
the observation is included in plots; observations excluded from plots do not have a marker symbol shown in the data table.
Similarly, the ![]() symbol is present if and only if the observation is included in analyses. If an observation is excluded from analyses but
included in plots, then the marker symbol changes to the
symbol is present if and only if the observation is included in analyses. If an observation is excluded from analyses but
included in plots, then the marker symbol changes to the ![]() symbol.
symbol.
For example, Figure 4.10 shows what the data table would look like if you excluded some observations. In this example, the second observation is included in plots but excluded from analyses. The third observation is excluded from plots but included in analyses. The fourth observation is excluded from both plots and analyses.