When you choose the select tool, the mouse pointer looks like a diagonally pointing arrow. Clicking a plot marker selects the corresponding observation. Clicking a bar in a histogram or bar chart selects all observations that are represented by that bar. Clicking a box plot quartile or whisker selects all observations in that quartile or whisker. By holding down the SHIFT or CTRL key, you can select multiple graphical elements.
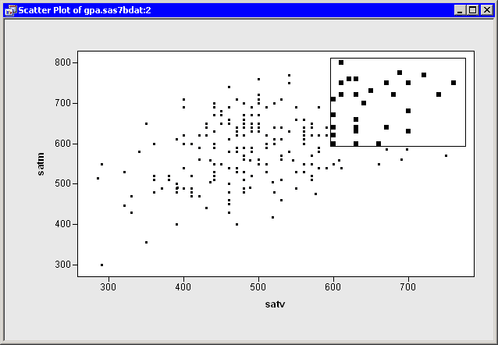
Dragging a rectangle selects all observations within that rectangle. The rectangle is also known as a brush. After a brush is created, you can move it by placing the mouse pointer inside the rectangle and dragging it to a new location. As the brush passes over observations, those observations are automatically selected, as shown in Figure 8.2. If you hold down the CTRL key while moving the brush, observations outside the brush are not deselected.
It is also possible to throw the brush. Release the mouse button while dragging the brush, and the brush begins moving freely in the direction in which you last dragged it. The brush bounces off the sides of the graph area. Throwing the brush can be computationally intensive when you are working with large data sets.
Note: If you click an observation, it is labeled in the plot. Details are given in the section Labeling Observations. Observations that are selected by using a brush are not labeled.