An axis label is text near an axis that identifies the axis variable. You can change the axis label. By default, plots display the name of a variable as the label. However, you might prefer that the plot display a variable’s label instead of its name. Or you might prefer to customize the axis label in some other way.
To change the axis label properties, right-click while the mouse pointer is on the axis label. You can then select from the pop-up menu. The Axis Label Properties dialog box appears, as shown in Figure 10.5.
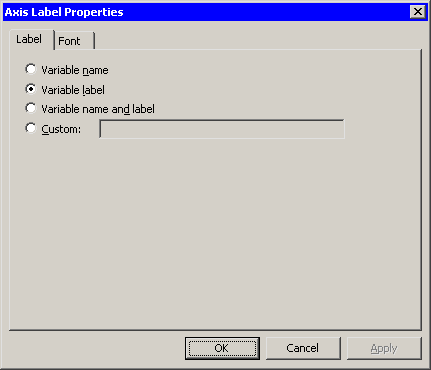
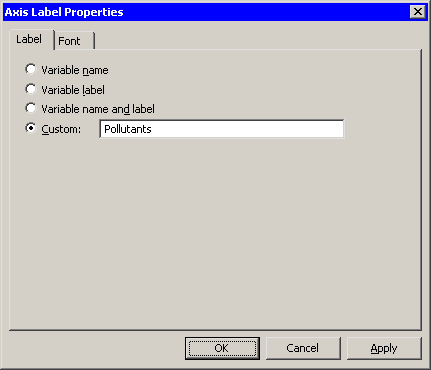
You can display a variable’s label instead of the variable’s name by selecting . If the variable does not have a label defined, or if you prefer to display a different label, you can select and type your own label. This is shown in Figure 10.6.
One instance in which you might want to define your own label is for a line plot that has multiple Y variables. If the Y variables
all measure different aspects of a single quantity, you can replace the multiple Y labels with a single custom label. For
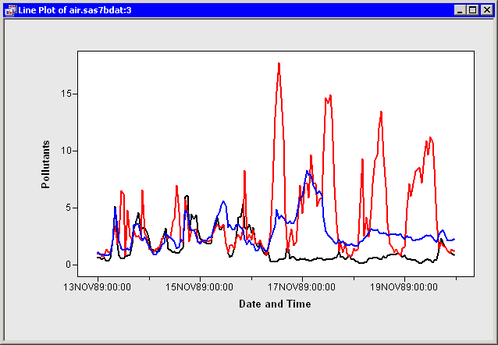
example, Figure 10.7 shows a line plot of the co, o3, and so2 variables versus datetime for the Air data set. Each of the Y variables is a kind of pollutant, so the three Y labels are replaced with a single custom label.