This section describes the Bars tab that is associated with a histogram. To access the histogram properties, right-click near the center of a plot, and select from the pop-up menu.
The Bars tab controls attributes of the histogram. The Bars tab is shown in Figure 5.8.
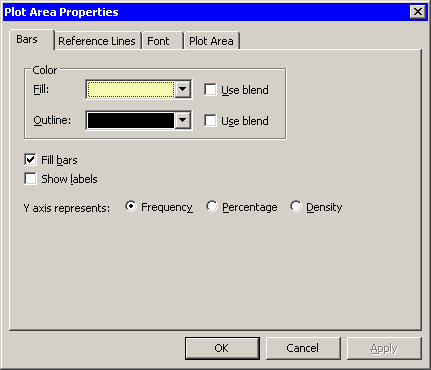
The Bars tab contains the following UI controls:
- Fill
-
sets the fill color for each bar.
- Fill: Use blend
-
sets the fill color for each bar according to a color gradient.
- Outline
-
sets the outline color for each bar.
- Outline: Use blend
-
sets the outline color for each bar according to a color gradient.
- Fill bars
-
specifies whether each bar is filled with a color. When not selected, only the outline of the bar is shown.
- Show labels
-
specifies whether each bar is labeled with the height of the bar.
- Y axis represents
-
specifies whether the vertical scale represents frequency counts, percentage, or density.
For a discussion of the remaining tabs, see Chapter 9: General Plot Properties.