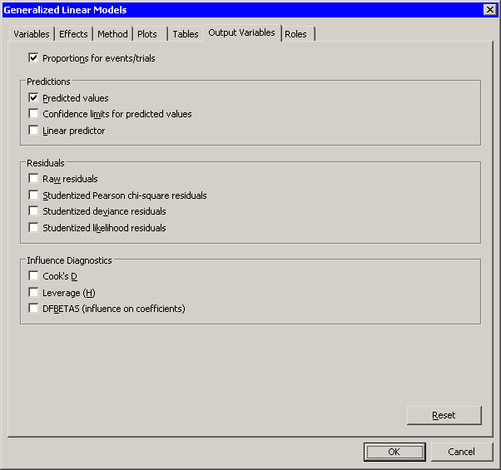
You can use the Output Variables tab to add analysis variables to the data table. (See Figure 24.24.) If you request a plot that uses one of the output variables, then that variable is automatically created even if you did not explicitly select the variable on the Output Variables tab.
For a multinomial response, residuals and influence diagnostics are not available.
The following list describes each output variable and indicates how the output variable is named. ![]() represents the name of the response variable. If you use events/trials syntax, then
represents the name of the response variable. If you use events/trials syntax, then ![]() represents the name of the events variable.
represents the name of the events variable.
- Proportions for events/trials
-
adds a variable named
Proportion_, where
 is the name of the events variable and
  is the name of the trials variable. The value of the variable is the ratio
  . This variable is added only when you use events/trials syntax.
- Predicted values
-
adds predicted values. The variable is named
GenP_.
- Confidence limits for predicted values
-
adds 95% confidence limits for the predicted values. The variables are named
GenLclm_and
GenUclm_.
- Linear predictor
-
adds the linear predictor values. The variable is named
GenXBeta_.
- Raw residuals
-
adds residuals, which are calculated as observed values minus predicted values. The variable is named
GenR_.
- Pearson chi-square residuals
-
adds the Pearson chi-square residuals. The variable is named
GenChiSqR_.
- Deviance residuals
-
adds the deviance residuals. The variable is named
GenDevR_.
- Likelihood residuals
-
adds the likelihood residuals. The variable is named
GenLikR_.
- Cook’s D
-
adds Cook’s
 influence statistic. The variable is named
 GenCooksD_.
- Leverage (H)
-
adds the leverage statistic. The variable is named
GenH_.
- DFBETAS (influence on coefficients)
-
adds
 variables, where is the number of parameters in the model. A classification variable with
  levels counts as parameters. The variables are scaled measures of the change in each parameter estimate and are calculated by deleting the
 th observation. Large values of DFBETAS indicate observations that are influential in estimating a given parameter. Belsley,
Kuh, and Welsch (1980) recommend
th observation. Large values of DFBETAS indicate observations that are influential in estimating a given parameter. Belsley,
Kuh, and Welsch (1980) recommend  as a size-adjusted cutoff. The variables are named
 DFBeta, for
 .
.