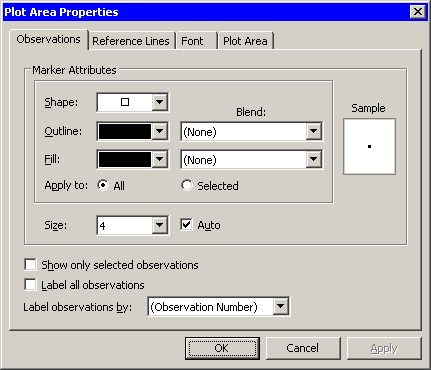
This section describes the Observations tab that is associated with a scatter plot. To access the scatter plot properties, right-click near the center of a plot, and select from the pop-up menu.
The Observations tab controls attributes of the scatter plot. The Observations tab is shown in Figure 6.9.
The Observations tab contains the following UI controls:
- Marker Attributes: Shape
- Marker Attributes: Outline
-
specifies the color of the marker boundary. If the list is set to , the list enables you to specify the outline color of observation markers. If the list is not set to , the list enables you to specify the color blend to be used to color the outlines of observation markers.
- Marker Attributes: Blend (Outline)
-
sets the variable whose values should be used to perform color blending for the outline colors of observation markers. If this value is set to , color blending is not performed.
- Marker Attributes: Fill
-
specifies the color of the marker interior. If the list is set to , the list enables you to specify the fill color of observation markers. If the list is not set to , the list enables you to specify the color blend to be used to color the interiors of observation markers.
- Marker Attributes: Blend (Fill)
-
sets the variable whose values should be used to perform color blending for the fill colors of observation markers. If this value is set to , color blending is not performed.
- Marker Attributes: Apply to
-
specifies whether marker shape and color changes are applied to all observations, or just to the ones currently selected.
- Marker Attributes: Size
-
specifies the size of observation markers. All observation markers in a plot are drawn at the same size. Selecting causes the size of markers to change according to the size of the plot.
- Show only selected observations
-
specifies whether observation markers are shown only for selected observations.
- Label all observations
-
specifies whether labels are displayed next to each observation marker.
- Label observations by
-
specifies the variable to use to label observations.
For a discussion of the remaining tabs, see Chapter 9: General Plot Properties.