In this section, you create many plots of variables in the Hurricanes data set. The following steps use the Workspace Explorer to manage the display of plots:
-
Open the
Hurricanesdata set. -
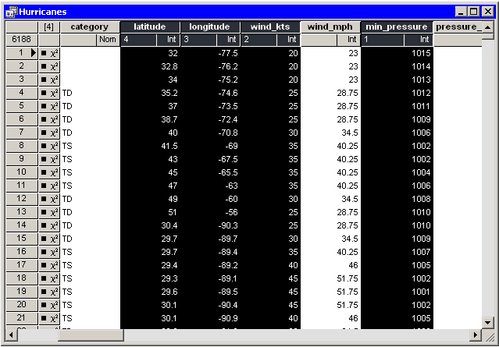
Scroll the data table horizontally until the
min_pressurevariable appears. Hold down the CTRL key while you select themin_pressure,wind_kts,longitude, andlatitudevariables, in that order.Figure 11.16 shows the selected variables. Note that the column headings display numbers that indicate the order in which you selected the variables.
-
Select → from the main menu.
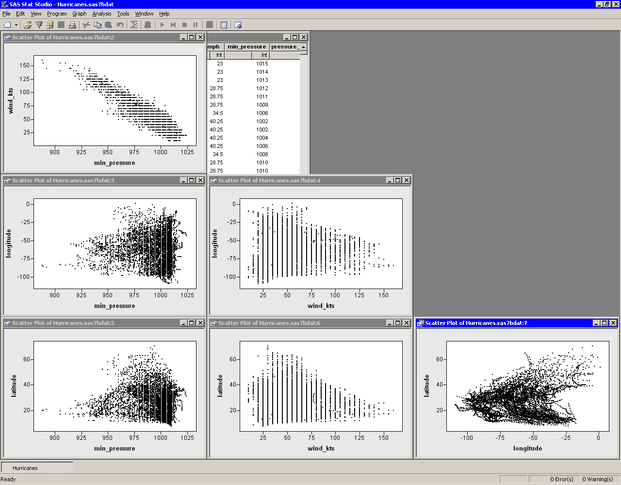
A matrix of scatter plots appears, as shown in Figure 11.17.
The scatter plot of
wind_ktsversusmin_pressureshow a strong negative correlation ( ) between wind speed and pressure. In the following steps, you model the linear relationship between these two variables and
create plots of the fit residuals.
) between wind speed and pressure. In the following steps, you model the linear relationship between these two variables and
create plots of the fit residuals.
-
Select → → from the main menu.
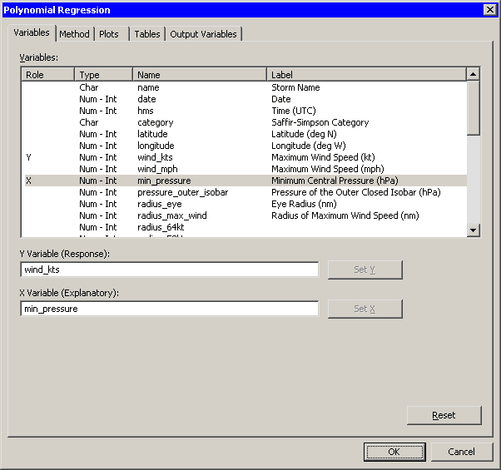
The dialog box shown in Figure 11.18 appears.
-
Select the variable
wind_kts, and click . Select the variablemin_pressure, and click . -
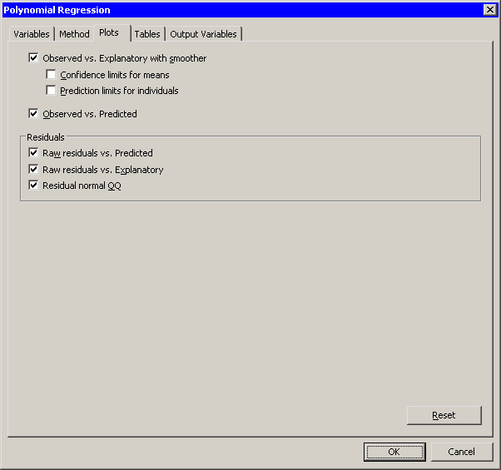
Click the Plots tab, as shown Figure 11.19.
-
Select all plots. Clear the check boxes and . Click .
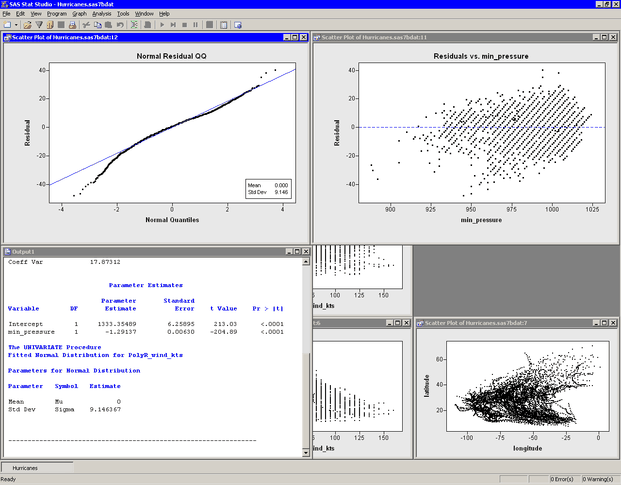
The analysis creates the five requested plots and an output window, as shown in Figure 11.20. Some of the plots produced by the analysis might be hidden beneath other plots.
Your workspace now has a data table, a matrix of six scatter plots, five plots that are associated with an analysis, and an output window, for a total of 13 windows. The Workspace Explore enables you to manage these windows.
-
Press ALT+X to open the Workspace Explorer.
The Workspace Explorer is shown in Figure 11.21.
You can use the Workspace Explorer to do the following:
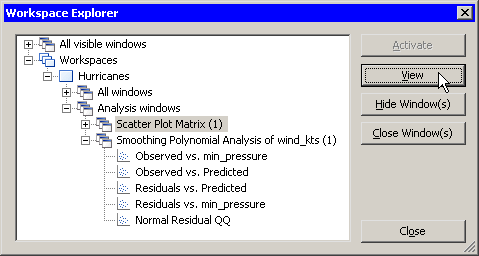
For example, if you want to see all of the windows that are associated with the scatter plot matrix, you can do the following steps.
-
Click the node labeled , and click .
This step is shown in Figure 11.22. The matrix of scatter plots becomes visible.
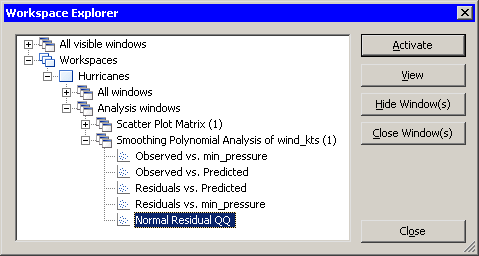
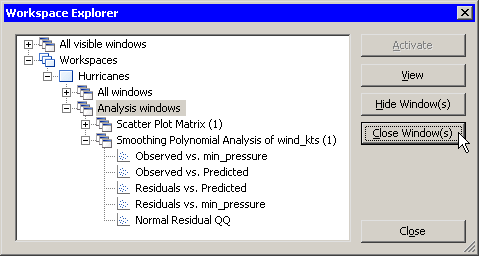
You also can view a particular plot. For example, the following steps activate the plot that contains the least squares line. -
In the Workspace Explorer, expand the node labeled , if it is not already expanded.
-
Click the item labeled .
This step is shown in Figure 11.23. The icon to the left of the plot name indicates that the plot is a scatter plot. The icons in the Workspace Explorer match the icons on the main menu.
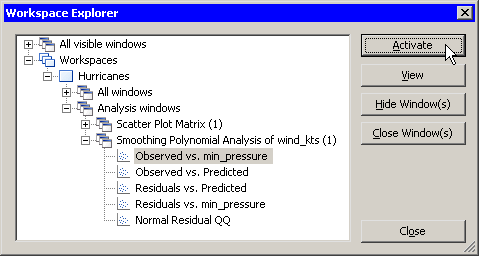
Note that the button is now active, whereas it was previously inactive. This is because the selected item is an individual window instead of a group of windows. behaves similarly to , but it also closes the Workspace Explorer and makes the selected window the active window.
-
Click .
-
When you are finished viewing a group of plots, the Workspace Explorer makes it easy to close them. Press ALT+X to open the Workspace Explorer. Click the node labeled . Click .
This step is shown in Figure 11.24. SAS/IML Studio closes all of the plots created in this example. You can close workspaces in the same way.
In summary, the Workspace Explorer enables you to view (or hide) windows. The following list describes each button in the Workspace Explorer.
- Activate
-
makes the selected window visible and active. Selecting this button also closes the Workspace Explorer.
- View
-
makes the selected window or group of windows visible.
- Hide Window(s)
-
hides the selected window or group of windows.
- Close Window(s)
-
closes the selected window or group of windows. You can also press the DELETE key to close the selected window or group of windows.
- Close
-
closes the Workspace Explorer.