In this section, you create several plots of variables in the Hurricanes data set. You use local selection mode to display the wind speed and pressure of tropical cyclones that satisfy certain spatial
and temporal criteria.
To use local selection mode:
-
Open the
Hurricanesdata set. -
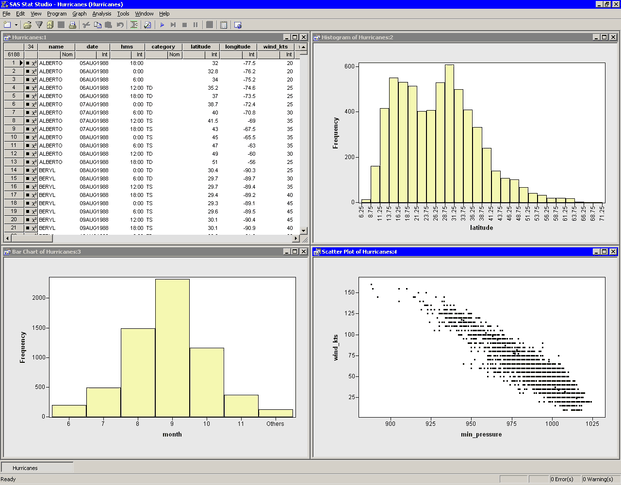
Create a histogram of the
latitudevariable.The histogram becomes one of the selector views.
The next plot to create is a bar chart of the
monthvariable. By default, themonthvariable is an interval (continuous) variable. In order to create a bar chart, you first need to change the measure level from interval to nominal. -
Scroll the data table horizontally until you see the
monthvariable. -
Right-click the heading of the
monthcolumn, and select from the pop-up menu. -
Create a bar chart of the
monthvariable. Move the bar chart so that it does not overlap other data views.The bar chart becomes a second selector view.
-
Create a scatter plot of
wind_ktsversusmin_pressure. Move the plot so that it does not overlap other data views.The scatter plot becomes an observer view. The workspace now looks like Figure 11.12.
-
Close the data table.
-
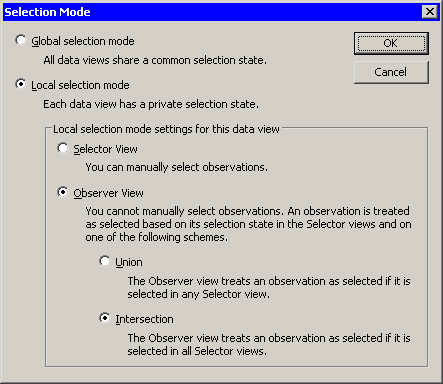
Right-click the plot area in the scatter plot. Select from the pop-up menu.
The dialog box shown in Figure 11.13 appears.
-
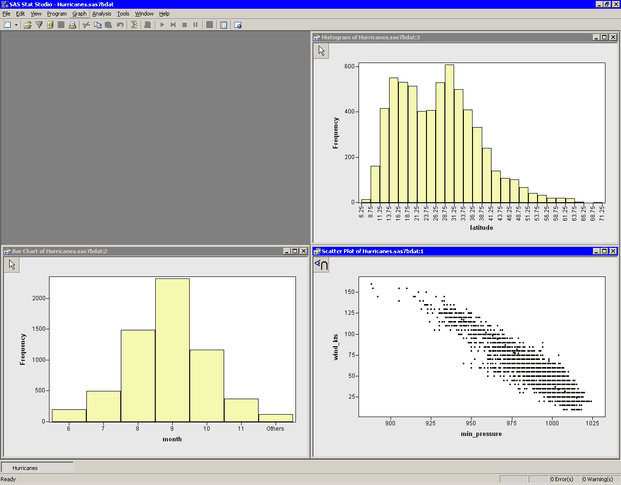
Click , , and . Click .
The workspace now looks like Figure 11.14. The scatter plot is an observer view. All of the other data views were set to be selector views when you entered local selection mode. Note that selector views are indicated by an arrow icon in the upper left corner of the view. Observer views are indicated by an icon that looks like an eye looking at the mathematical symbol for intersection (or union).
Note: If you forget to close the data table, then it, too, is a selector view. A common error is to leave the data table open. If the data table is left open, then no observations are selected in the observer scatter plot unless they are selected in all other selector views, including data tables.
-
In the bar chart, click the bar labeled “10” to select observations that correspond to the tenth month (October).
The histogram does not display any observations because it is a selector view. The scatter plot does not display any observations because it is an observer view; it displays observations as selected only if they are selected in all selector views.
-
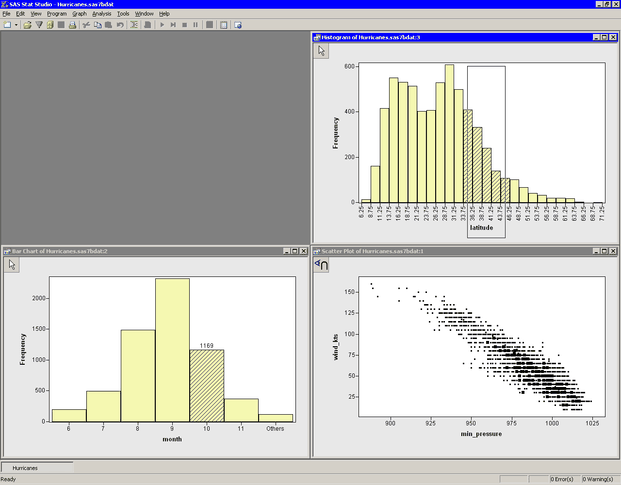
Create a selection rectangle in histogram. Move it around the plot.
The workspace now looks like Figure 11.15.
The observations displayed as selected in the scatter plot are those that are selected in both the bar chart and the histogram. The selected observations in the scatter plot in Figure 11.15 are those tropical storms that occurred in October (
month= 10) of any year and whose position was between 33.75 and 46.25 degrees north latitude.