In this example, you label observations in a scatter plot according to values of a third variable.
-
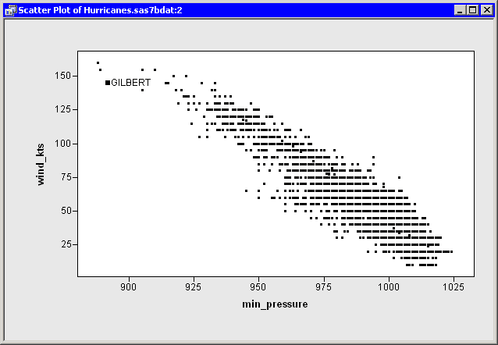
Open the
Hurricanesdata set and create a scatter plot ofwind_ktsversusmin_pressure.The scatter plot appears. (See Figure 9.14.)
-
Click an observation.
The selected observation is labeled by its position in the data table.
-
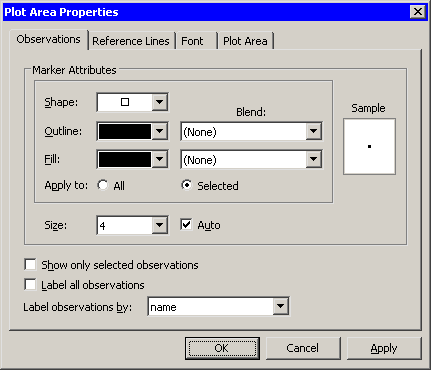
Right-click near the center of the plot, and select from the pop-up menu.
The Plot Area Properties dialog box appears. (See Figure 9.15.)
-
Select from the list.
-
Click .
The label for the selected observation updates, as shown in Figure 9.16. If you click subsequent observations, each label displays a storm name.

Note: When you select on the Plot Area Properties dialog box, it only affects the scatter plot to which the dialog box belongs. If you create a second plot, that new plot defaults to using observation numbers to label observations.
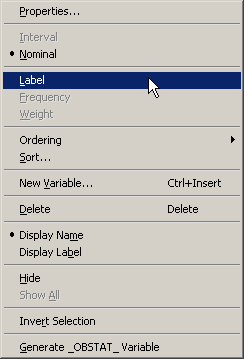
You can also set a default label variable that is used for all plots. In the data table, right-click a variable heading. Select from the pop-up menu, as shown in Figure 9.17. The values of the selected variable are displayed when you click observations in a plot (unless that plot overrides the default).