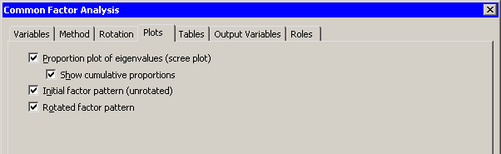
You can use the Plots tab to create plots that display results of the analysis. (See Figure 27.13.)
The plots for the Factor analysis are not linked to the original data table. The scree plot has its own data table; the two factor pattern plots (also called factor loading plots) are linked to each other. You can view the data for a plot by pressing the F9 key when the plot is active.
The following plots are available:
- Proportion plot of eigenvalues (scree plot)
-
creates a plot that summarizes the eigenvalues of the reduced correlation or reduced covariance matrix.
- Show cumulative proportions
-
adds cumulative proportions of eigenvalues to the proportion plot.
- Initial factor pattern (unrotated)
-
creates a plot that shows the relationships between the initial (unrotated) factors and the original variables.
- Rotated factor pattern
-
creates a plot that shows the relationships between the final rotated factors and the original variables. This plot is created only if you specify a rotation on the Rotation tab.