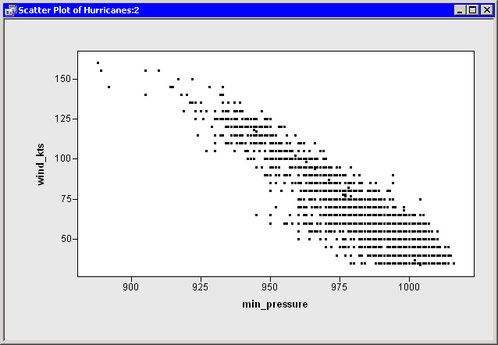
The following steps examine the relationship between wind speed and atmospheric pressure for tropical cyclones. The National Hurricane Center routinely reports both of these quantities as indicators of a storm’s intensity. The figures in this section assume that you have excluded observations with low wind speeds as described in the section Exclude Observations.
-
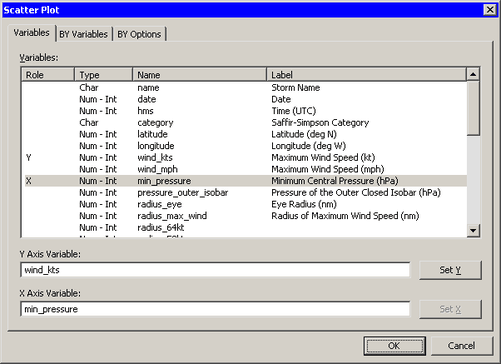
Select → from the main menu.
The Scatter Plot dialog box appears. (See Figure 2.13.)
-
Select the variable
wind_kts, and click . -
Select the variable
min_pressure, and click . -
Click .
A scatter plot appears as in Figure 2.14.