To create a bar chart of the category variable:
-
Select → from the main menu.
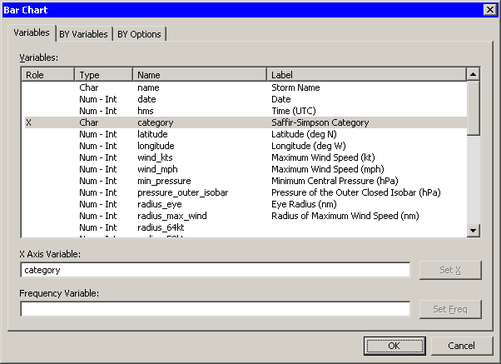
The Bar Chart dialog box appears. (See Figure 2.3.)
-
Select the variable
category, and click .Note: In most dialog boxes, double-clicking a variable name adds the variable to the next appropriate field.
-
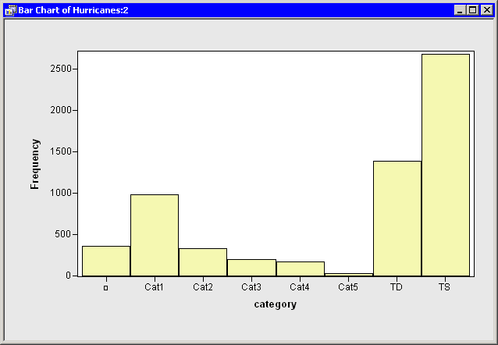
Click .
The bar chart in Figure 2.4 appears. The bar chart shows the number of observations for storms in each Saffir-Simpson intensity category.