Adding Titles, Legends, and Insets
This section adds an inset to the graph that shows the number of observations used in the regression and the R-square value of the fitted model. You can add an inset by using the DrawInset module that is distributed with SAS/IML Studio. The module is documented in the SAS/IML Studio online Help. The following statements show one choice for creating an inset. Add the following statements at the bottom of the program window, and select → from the main menu.
   Labels = {"Num Obs" "R-Square"};
   Values = N[2] || NValue2[1];
   LabelProps = .;          /* accept default settings for labels */
   LabelTypeface = "Arial"; /* font */
   BackgroundColor = -1;    /* no color (transparent) */
   Location = 'IRT';        /* Inside, Right, Top */
   run DrawInset( FitPlot, Labels, Values,
                    LabelProps, LabelTypeface,
                    BackgroundColor, Location );
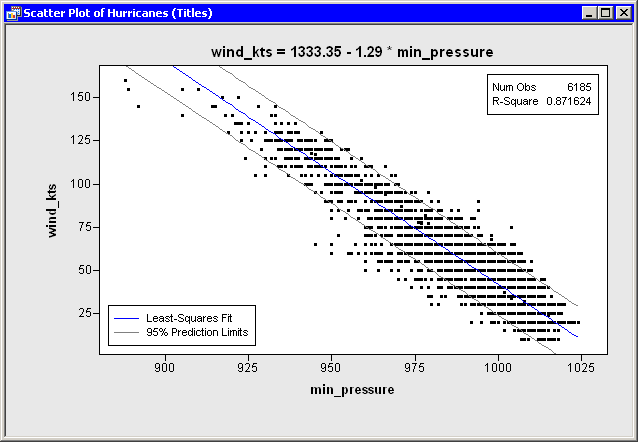
Figure 8.2 shows the title, the legend, and the inset created in this chapter.