Introduction to SAS/IML Studio
The most important class in SAS/IML Studio is the DataObject class. The DataObject class manages an in-memory version of your data. It provide methods to query, retrieve, and manipulate the data. It manages graphical information about observations such as the shape and color of markers, the selected state of observations, and whether observations are displayed in plots or hidden. Figure 1.3 is a schematic depiction of a DataObject.
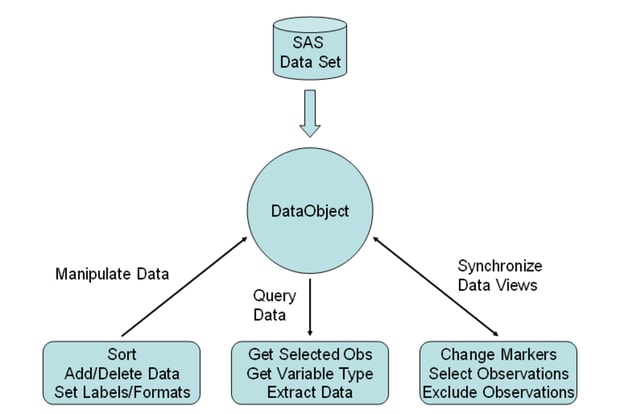
A DataObject is usually created from a SAS data set. (Other methods of creating DataObjects, such as from Microsoft Excel files or from SAS/IML matrices, are discussed in the online Help.) However, after the DataObject is created, the data in the DataObject are independent from the data used to initialize it. For example, you might use methods of the DataObject class to add new variables, transform existing variables, sort by one or more variables, delete observations, or exclude observations from being plotted. None of these operations affect the original SAS data set unless the DataObject is saved back onto disk with the same filename.
The DataObject class provides methods that query the data. For example, a DataObject can provide you with the number of variables and observations in the in-memory copy of the data. You can query for a variable’s label or format, or for whether a variable contains nominal numeric data. You can request the DataObject to return a vector that contains the values of a particular variable. The values can then be used in a statistical analysis or to subset the data.
The DataObject class does not have any visible manifestation. Rather, you can create tabular and graphical views of the data from a DataObject. Every data table and every plot has an underlying DataObject, and usually several plots or tables share the same DataObject.
The most important role of the DataObject class is to synchronize all graphs and data tables that view the same data. Thus it is the DataObject class that enables dynamically linked views of data. This is schematically depicted in Figure 1.4.
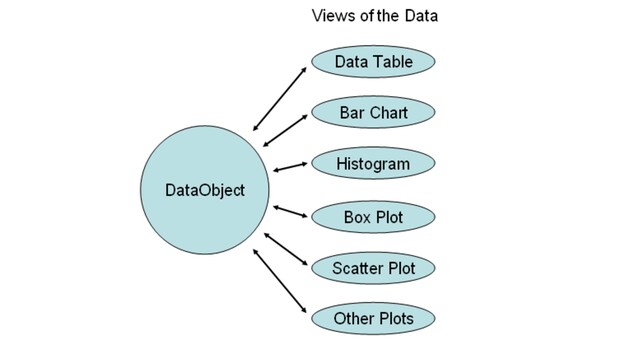
For example, the DataObject class keeps track of which observations are selected. When you interact with a graph or data table in order to select observations, your selections are remembered by the underlying DataObject. All graphs and tables that are linked to the DataObject are alerted so that they can update their displays to display the new set of selected observations.
Similarly, the DataObject class contains methods that manage markers for each observation. You can set the shape and color of an observation marker by using DataObject methods. Whenever an individual observation is plotted, it has the same shape and color in all graphs that display it.
In summary, the DataObject class is an in-memory version of data, together with methods to query and manipulate data and graphical attributes associated with observations. The purpose of the DataObject class is to ensure that all graphical and tabular views of the data display observations with the same markers and selection state.