Introduction to SAS/IML Studio
Although you can use SAS/IML Studio as a point-and-click tool for exploratory data analysis, there are advantages to writing programs in SAS/IML Studio. Writing programs enables you to do the following:
-
create your own customized statistical graphs
-
add legends, curves, maps, or other custom features to statistical graphs
-
develop interactive programs that use dialog boxes
-
extend the built-in analyses by calling SAS procedures
-
create custom analyses
-
repeat an analysis on different data
-
extend the results of SAS procedures by using SAS/IML statements
-
share analyses with colleagues who also use SAS/IML Studio
-
call functions and user-contributed packages of the R language
-
call functions from libraries written in C/C++, FORTRAN, or Java
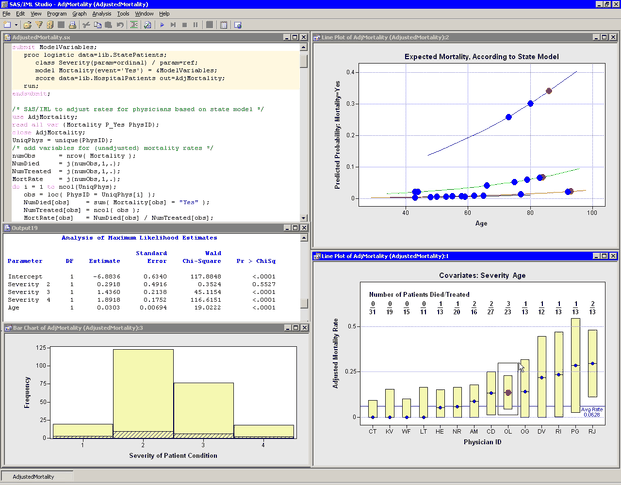
Figure 1.2 shows the results of a program that evaluates the mortality of patients admitted to a certain hospital with congestive heart failure. The program uses a statewide database to build a logistic model that predicts mortality as a function of a patient’s age and the severity of her condition. The program uses SAS/IML statements to compute an adjusted mortality rate (with confidence limits) for cardiac physicians employed by the hospital. The adjusted rates are based on the observed number of deaths, the expected number of deaths (as predicted by the statewide model), and the mean number of deaths for this hospital.
The program implements many of the features listed previously. It creates a custom graphic with explanatory text. It calls DATA steps and the LOGISTIC procedure. It extends the results of the LOGISTIC procedure by using SAS/IML statements to compute adjusted mortality rates. It presents SAS/IML Studio’s dynamically linked graphs to enable you to explore why some physicians have high rates of patient mortality, to decide whether those rates are unacceptably high, and to evaluate the overall performance of this hospital’s staff compared to staff at other hospitals in the state. Although not shown in Figure 1.2, the program even uses a dialog box to enable you to choose the explanatory effects used to create the logistic model.