You do not need to do anything special to call an R package. Provided that an R package is installed, you can call library(package) from inside a SUBMIT block to load the package. You can then call the functions in the package.
Similarly, you do not need to do anything special to call R graphics. The graph appears in the standard R graphics window.
The example in this section calls an R package and creates a graph in R.
In Chapter 6: Adding Curves to Graphs, you called the KDE procedure to compute a kernel density estimate for the min_pressure variable in the Hurricanes data set. The following program reproduces that analysis by calling functions in the KernSmooth package and creating a histogram
in R:
declare DataObject dobj;
dobj = DataObject.CreateFromFile("Hurricanes");
dobj.GetVarData("min_pressure", p);
run ExportMatrixToR( p, "Pressure" );

submit / R;
   library(KernSmooth)
   idx <-which(!is.na(Pressure))     # must exclude missing values (NA)
   p <- Pressure[idx]                #    from KernSmooth functions
   h = dpik(p)                       # Sheather-Jones plug-in bandwidth
   est <- bkde(p, bandwidth=h)       # est has 2 columns

   hist(p, breaks="Scott", freq=FALSE, col="lightyellow") # histogram
   lines(est)                                             # kde overlay
endsubmit;
The program creates an R matrix Pressure from the data in the min_pressure variable. Because the functions in the KernSmooth package do not handle missing values, the nonmissing values in Pressure must be copied to a matrix p. The Sheather-Jones plug-in bandwidth is computed by calling the dpik function in the KernSmooth package. This bandwidth is used in the bkde function (in the same package) to compute a kernel density estimate.
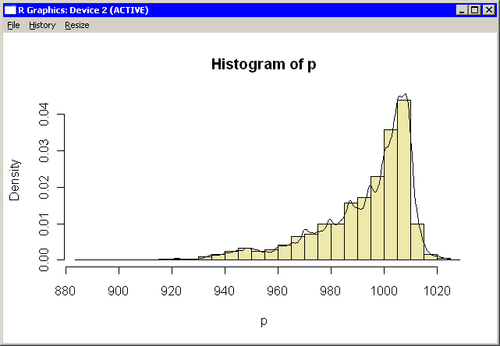
The hist function creates a histogram of the data in the p matrix, and the lines function adds the kernel density estimate contained in the est matrix.
The R graphics window contains the histogram, which is shown in Figure 11.5. You can compare the histogram and density estimate created by R with the IMLPlus graph shown in Figure 6.4.
