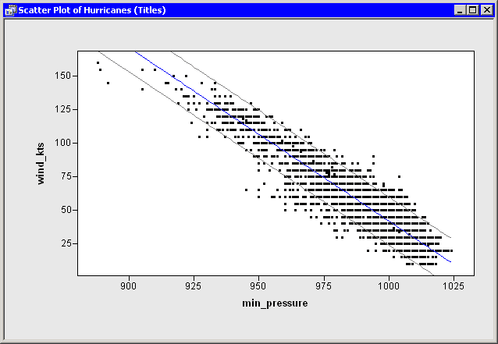
In previous chapters you performed a linear regression with PROC REG, and you created a scatter plot that shows the fitted model and 95% confidence intervals for individual predictions as shown in Figure 8.1.
Suppose now that you want to add a title and legends to the graph that results from the linear regression. Specifically, you want to display the following information:
-
a title that shows the fitted model
-
a legend that explains the different colors of lines in the plot
-
an inset that shows the number of observations used in the regression and the R-square value of the fitted model
In Chapter 7: Reading ODS Tables, you learned how to get all of the needed information out of the ODS tables output by using PROC REG. The program that follows combines ideas from previous chapters. Copy the following statements into a program window, and select → from the main menu.
   declare DataObject dobj;
   dobj = DataObject.CreateFromFile("Hurricanes");

   dobj.WriteVarsToServerDataSet( {"wind_kts" "min_pressure"},
      "Work", "Hurr", true );

   submit;
   proc reg data=hurr plots=none;
      model wind_kts = min_pressure;
      output out=RegOut P=Pred LCL=LCL UCL=UCL;
      ods output NObs = RegNObs
                 FitStatistics = RegFitStat
                 ParameterEstimates = RegParamEst;
   run;
   endsubmit;

   ok = CopyServerDataToDataObject( "Work", "RegOut", dobj,
      {"Pred" "LCL" "UCL"}, /* names on server */
      {"Pred" "LCL" "UCL"}, /* names in DataObject */
      {"Predicted" "Lower Conf. Limit" "Upper Conf. Limit"},
      true );

   declare ScatterPlot FitPlot;
   FitPlot = ScatterPlot.Create( dobj, "min_pressure", "wind_kts" );

   dobj.Sort( "min_pressure" );
   dobj.GetVarData( "min_pressure", minPress );
   dobj.GetVarData( "Pred", pred );
   FitPlot.DrawUseDataCoordinates();
   FitPlot.DrawSetPenColor( BLUE );
   FitPlot.DrawLine( minPress, pred );

   dobj.GetVarData( "LCL", lower );
   dobj.GetVarData( "UCL", upper );
   FitPlot.DrawSetPenColor( GRAY );
   FitPlot.DrawLine( minPress, lower );
   FitPlot.DrawLine( minPress, upper );

   use RegNObs;     read all var {N};        close RegNObs;
   use RegFitStat;  read all var {NValue2};  close RegFitStat;
   use RegParamEst; read all var {Estimate}; close RegParamEst;

   print N[ rowname={"Num Read","Num Used","Num Missing"} ],
         NValue2[ rowname={"R-Square","Adj R-sq"," "} ],
         Estimate[ rowname={"Intercept","min_pressure"} ];