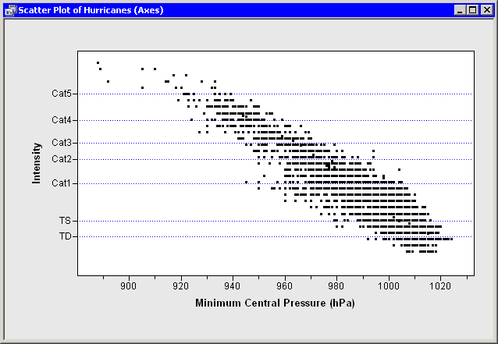
Up to this point, this example has shown you how to construct uniformly spaced tick marks at locations of your choosing. You can also draw tick marks that are not uniformly spaced by using the SetAxisTicks method of the Plot class. This method can also be used to display labels for ticks that are different from the numerical values of the ticks. For example, you might decide that you want the tick marks on the vertical axis to show the categories of the Saffir-Simpson intensity scale (Table 9.1).
Table 9.1: The Saffir-Simpson Intensity Scale
|
Category |
Wind Speed (knots) |
|---|---|
|
Tropical depression (TD) |
22–34 |
|
Tropical storm (TS) |
34–64 |
|
Category 1 hurricane (Cat1) |
64–83 |
|
Category 2 hurricane (Cat2) |
83 –96 |
|
Category 3 hurricane (Cat3) |
96 –114 |
|
Category 4 hurricane (Cat4) |
114 –135 |
|
Category 5 hurricane (Cat5) |
greater than 135 |
Add the following statements at the bottom of the program window, and select → from the main menu. Figure 9.4 shows the tick locations and labels for the vertical axis.
   plot.SetAxisLabel( YAXIS, "Intensity" );
   StormTicks  = {22 34 64 83 96 114 135};
   StormLabels = {'TD' 'TS' 'Cat1' 'Cat2' 'Cat3' 'Cat4' 'Cat5'};
   plot.SetAxisTicks( YAXIS, StormTicks, StormLabels );
   plot.ShowAxisReferenceLines( YAXIS );