| Adding Titles, Legends, and Insets |
Create an Inset Based on an Analysis
This section adds an inset to the graph that shows the number of observations used in the regression and the R-square value of the fitted model. You can add an inset by using the DrawInset module that is distributed with SAS/IML Studio. The module is documented in the SAS/IML Studio online Help. The following statements show one choice for creating an inset. Add the following statements at the bottom of the program window, and select Program  Run from the main menu.
   Labels = {"Num Obs" "R-Square"};
   Values = N[2] || NValue2[1];
   LabelProps = .;          /* accept default settings for labels */
   LabelTypeface = "Arial"; /* font */
   BackgroundColor = -1;    /* no color (transparent) */
   Location = 'IRT';        /* Inside, Right, Top */
   run DrawInset( FitPlot, Labels, Values,
                    LabelProps, LabelTypeface,
                    BackgroundColor, Location );
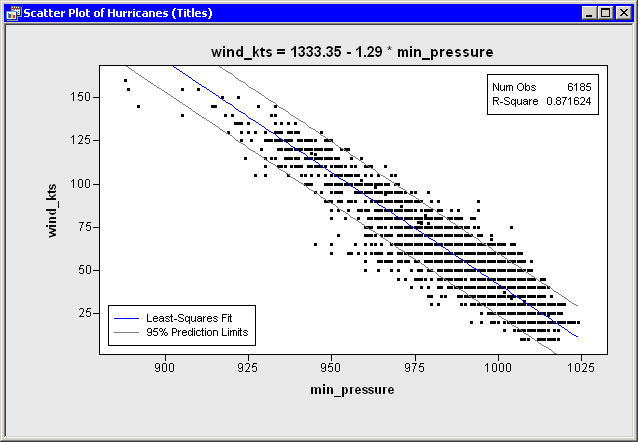
Figure 8.2 shows the title, the legend, and the inset created in this chapter.
Figure 8.2
Plot with Title, Legend, and Inset
Copyright © SAS Institute, Inc. All Rights Reserved.