| Adjusting Axes and Locations of Ticks |
Adjust Tick Marks for a Histogram
For a histogram, the location of tick marks determines the bins used to visualize the frequency distribution. Therefore, the Histogram class has some special rules for specifying tick marks.
Create a histogram by adding the following statements at the bottom of the program window, and select Program  Run from the main menu.
   declare Histogram hist;
   hist = Histogram.Create( dobj, "latitude" );
   hist.SetWindowPosition( 50, 50, 50, 50 );
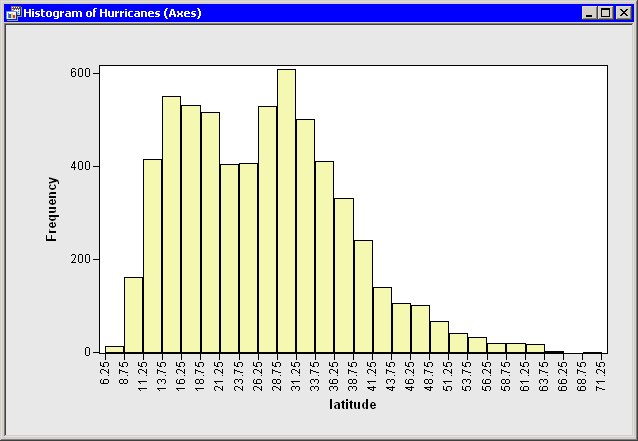
These statements create a histogram from the latitude variable as shown in Figure 9.5. To avoid having the histogram appear on top of the scatter plot, the SetWindowPosition method is called to move the histogram into the lower right corner of the SAS/IML Studio workspace.
For a histogram, the major tick unit is also the width of each histogram bin. The tick marks for this histogram are anchored at 6.25 and have a tick unit of 2.5. The following steps show you how to change the location of the histogram ticks so that the bins show the frequency of observations in the intervals 5–10, 10–15, 15–20, and so on.
Right-click on the horizontal axis of the histogram. A pop-up menu appears as in Figure 9.6.
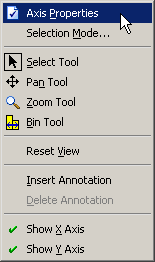
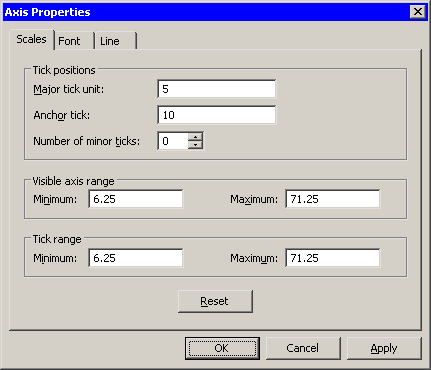
Select Axis Properties from the pop-up menu. The Axis Properties dialog box appears as in Figure 9.7. This is a quick way to determine the anchor location, tick unit, and tick range for an axis.
Change the value in the Major tick unit box to 5.
Change the value in the Anchor tick box to 10.
Click OK.
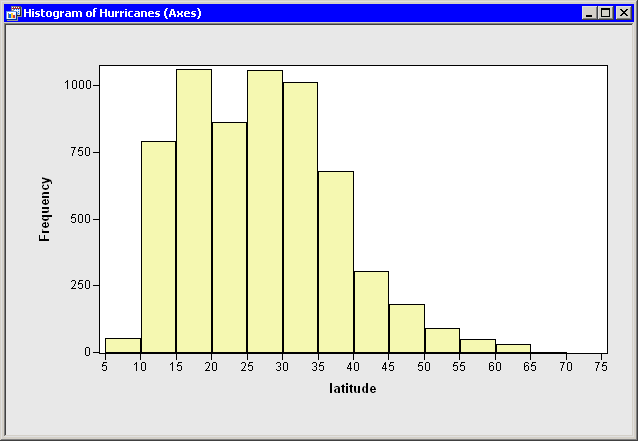
The histogram updates to reflect the new histogram bin locations (Figure 9.8). The visible axis range and the tick range (both shown in Figure 9.7) are automatically widened, if necessary, so that all histogram bins are visible.
You can also change the location and width of histogram bins by using program statements. For example, the Histogram class has a special ReBin method that you can often use to change the anchor tick and the major tick unit in a single method call. However, in the current example, you do not get tick marks at 0 or at 75 if you use only the following statement:
hist.ReBin( 10, 5 );
This is because no tick mark can be outside the interval specified by the Tick Range values in Figure 9.7, and the tick range for this example is [6.25, 71.25]. You can adjust the axis tick range by using the SetAxisTickRange method of the Plot class:
   hist.SetAxisTickRange( XAXIS, 0, 75 );
   hist.ReBin( 10, 5 );
Another solution is to use the SetAxisNumericTicks method of the Plot class to change the bin locations of a histogram. This method requires that you specify the tick anchor, unit, and range, all in the same call.
hist.SetAxisNumericTicks( XAXIS, 10, 5, 0, 75 );
Copyright © SAS Institute, Inc. All Rights Reserved.