Creating a Graph Template
Quick Look at a GTL Graph Definition
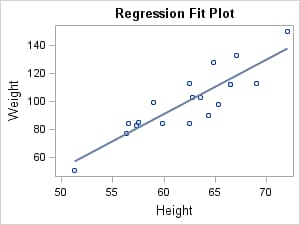
To illustrate the steps
needed to create a graph, assume that we want to produce a graph showing
a linear regression fit for a set of data where HEIGHT is an independent
variable and WEIGHT is a dependent variable.
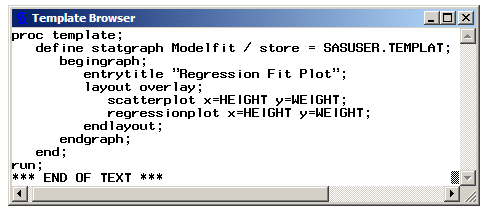
More Detailed Look at a GTL Graph Definition
The TEMPLATE procedure
can produce different types of templates, like STYLE, TABLE, COLUMN,
and STATGRAPH. The type of template to be created is specified with
a DEFINE statement.
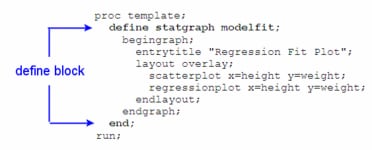
The DEFINE STATGRAPH statement and its matching END statement
indicate that a graphics template named MODELFIT is to be created.
The template name can be a simple one-level name or a multi-level
name such as GRAPHS.MODELFIT or PROJECT.STUDY3.MODELFIT indicating
the folder in which the MODELFIT template is to be stored.
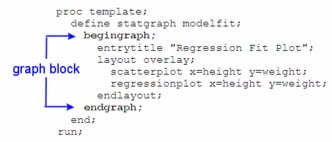
The BEGINGRAPH
statement and its matching ENDGRAPH statement define the outermost
container for the graph. It supports options for sizing the graph.
Within this block, you can use various statements that define the
content of the graph.
ENTRYTITLE and ENTRYFOOTNOTE
statements can be used to specify graph title lines and graph footnote
lines, if needed.
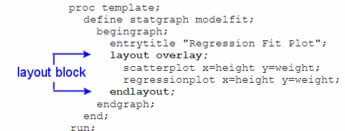
The LAYOUT OVERLAY statement and its matching ENDLAYOUT
statement define the type of graphical layout to be used. The OVERLAY
layout allows the contained plots to be overlaid. It manages the plot
layers and queries all contained plots to decide the axis types, axis
labels, and axis ranges.
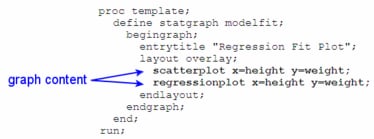
Both the SCATTERPLOT and REGRESSIONPLOT
statements specify HEIGHT for the X variable and WEIGHT for the Y
variable. For the regression, X is always used for the independent
variable and Y for the dependent variable. By default, a linear regression
is used.
For more information
about the types of layouts and plots in GTL, see Overview of Basic Statements and Options.
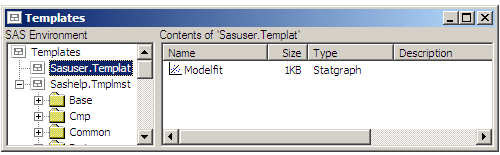
Compiling the Template
If
no syntax error is detected, a compiled template named MODELFIT is
created and stored physically in the SASUSER.TEMPLAT item store by
default. This item store is chosen by default because it is the first
item store that can be updated in the current ODS path.
It should be noted that
STATGRAPH template syntax requires that any necessary arguments be
specified (X= and Y= arguments are required for both the SCATTERPLOT
and REGRESSIONPLOT statements), but no checking for the existence
of the assigned variables is performed at compile time. Also note
that no reference to an input data set appears in the template.
Compiling the template
does not produce a graph—it only creates a compiled template
that can be executed to produce a graph.