Adding Graphics Elements to your Graph
The Draw Statements
Adding Text
In your DRAWTEXT statement,
specify in “text”
the text that you want to appear in your text element. You must enclose
the text in quotes. If you want to change any attributes of the text
such as the font family, font size, or font color, include the necessary
options in the TEXTATTRS= option in the DRAWTEXT statement.
Use the X= and Y= options
in the DRAWTEXT statement to specify the coordinates where you want
to place the text. By default, the coordinate units are GRAPHPERCENT,
and the text element is anchored on its center point at the specified
coordinates. In options , you
can include the DRAWSPACE= option or the XSPACE= and YSPACE= options
to specify different units, and the ANCHOR= option to change the anchor
point.
If you want text to
wrap within a specified area, include the WIDTH= option in options . The WIDTH= option specifies the maximum
width of the text area in PERCENT units by default. You can include
the WIDTHUNIT= option in options to specify PIXEL or DATA units instead. If you want to add a border
around your text, include the BORDER=TRUE and the BORDERATTRS= options
in options .
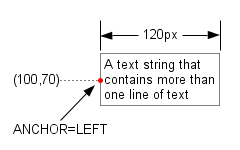
Here is an example of
a DRAWTEXT statement that adds a 120-pixel-wide block of text with
a gray border.
drawtext "A text string that contains more than one line of text" /
   x=100 y=70 drawspace=graphpixel
   width=120 widthunit=pixel
   anchor=left
   border=true borderattrs=(color=gray pattern=1);
The X= and Y= options
specifies the coordinates of the anchor point as (100, 70) in GRAPHPIXEL
units. The ANCHOR= option specifies that the text is to be anchored
at the LEFT anchor point as shown in the following figure. The WIDTH=
and WIDTHUNIT= options specify the maximum width of the text block
as 120 pixels.
Adding Arrows and Lines
Use a DRAWARROW or DRAWLINE statement
to draw an arrow or line on your graph. The basic syntax is as follows:
The X1=, Y1=, X2=, and
Y2= options on the DRAWARROW and DRAWLINE statements specify the coordinates
for each endpoint of the arrow or line. By default, the coordinate
units are GRAPHPERCENT. You can include the DRAWSPACE= option, or
the X1SPACE=, Y1SPACE=, X2SPACE=, and Y2SPACE= options in options to specify different units. If you specify
DATAVALUE as the units and you want to scale your arrow or line to
the secondary axis, you must also include the X1AXIS=X2, Y1AXIS=Y2,
X2AXIS=X2, and Y2AXIS=Y2 options.
For both arrows and
lines, include the LINEATTRS= option in options to specify the line pattern, thickness, and color. For arrows, open
arrowheads that point in the outward direction are the default. To
change the arrowhead shape, include the ARROWHEADSHAPE= option and
specify CLOSED, FILLED, or BARBED. You can also include the ARROWHEADSCALE=
option to scale the arrowhead based on the thickness of the arrow
line. The scaling factor is 1 by default. You can scale the arrowhead
from a minimum of 0.5 to a maximum of 2.
To change the arrowhead
direction, include the ARROWHEADDIRECTION= option in options and specify IN or BOTH. The IN direction
positions the arrowhead on the (X1, Y1) endpoint and points it inward
toward the (X1, Y1) endpoint. The BOTH direction includes both IN
and OUT arrowheads forming a two-way arrow.
drawarrow x1=60 y1=70 x2=190 y2=70 / drawspace=graphpixel
   lineattrs=(pattern=3 thickness=1px)
   arrowheadshape=barbed arrowheadscale=2 arrowheaddirection=both;
The arrow is drawn from
endpoint (60, 70) to endpoint (190, 70) in GRAPHPIXEL units as shown
in the following figure.
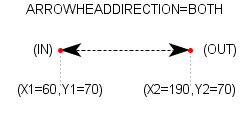
The LINEATTRS= option
specifies a dashed line (PATTERN=3) that is one pixel wide. The ARROWHEADSHAPE=
option specifies a barbed arrowhead, and the ARROWHEADSCALE= option
specifies a scale factor of 2 (maximum size). The ARROWHEADDIRECTION=
option specifies a two-way arrow.
To draw a line, in your
DRAWLINE statement, use the X1=, Y1=, X2=, and Y2= options to specify
the location of the endpoints. Include the LINEATTRS= option in options to specify the line pattern, color, and
thickness. Here is the previous example modified to draw a dashed
line instead of a dashed arrow at the same coordinates.
Adding Geometric Shapes
Ovals
The X= and Y= options
in the DRAWOVAL statement specify the coordinates of the oval anchor
point. By default, the coordinate units are GRAPHPERCENT, and the
oval is anchored on its center point. You can include the DRAWSPACE=
option, or the XSPACE= and YSPACE= options in options to specify different units. If you choose DATAVALUE as the coordinate
units and you want to scale the oval to the secondary axis, you must
also include the XAXIS=X2 and YAXIS=Y2 options. You can include the
ANCHOR= option to change the anchor point.
The WIDTH= and HEIGHT=
options in the DRAWOVAL statement specify the dimensions of the oval
in PERCENT units by default. You can include the WIDTHUNIT= and HEIGHTUNIT=
options in options to specify
PIXEL or DATA units instead.
You can change other
attributes of the oval, such as the fill color, the outline color,
and the outline pattern. Include the FILLATTRS= option in options to change the fill color, and include
the OUTLINEATTRS= option to change the outline color and pattern.
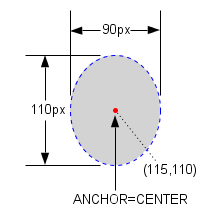
Here is an example of
a DRAWOVAL statement that adds a 90 pixel wide by 110 pixel high oval
at coordinates (115, 110) in GRAPHPIXEL units.
Rectangles
The X= and Y= options
in the DRAWRECTANGLE statement specify the coordinates of the anchor
point of the rectangle. By default, the coordinate units are GRAPHPERCENT,
and the rectangle is anchored on its center point. You can include
the DRAWSPACE= option, or the XSPACE= and YSPACE= options in options to specify different units. If you choose
DATAVALUE as the coordinate units and you want to scale the rectangle
to the secondary axis, you must also include the XAXIS=X2 and YAXIS=Y2
options. You can include the ANCHOR= option to change the anchor point.
The WIDTH= and HEIGHT=
options in the DRAWRECTANGLE statement specify the dimensions of the
rectangle in PERCENT units by default. You can include the WIDTHUNIT=
and HEIGHTUNIT= options in options to specify PIXEL or DATA units instead.
You can change other
attributes of the rectangle, such as the fill color, the outline color,
and the outline pattern. Include the FILLATTRS= option in options to change the fill color, and include
the OUTLINEATTRS= option to change the outline color and pattern.
Here is an example of
a DRAWRECTANGLE statement that adds a 60% wide by 40% high rectangle.
In this example, percent refers to the percentage of the drawing area,
at coordinates (80,80) in GRAPHPIXEL units.
drawrectangle x=80 y=80 width=60 height=40 / drawspace=graphpixel
   widthunit=percent heightunit=percent
   anchor=bottomleft
   display=all
   fillattrs=(color=lightgray)
   outlineattrs=(color=blue pattern=shortdash thickness=1px);
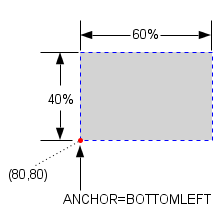
The ANCHOR= option specifies
the rectangle anchor point as BOTTOMLEFT, which positions the lower
left corner at coordinates (80, 80). The DISPLAY=ALL option displays
the outline and fill. The FILLATTRS= option specifies a light gray
fill, and the OUTLINEATTRS= option specifies a blue dashed outline.
Polylines
Use a
BEGINPOLYLINE/ENDPOLYLINE block to add a polyline to your graph. The
basic syntax is as follows:
BEGINPOLYLINE X=origin-x Y=origin-y / <options>;
   DRAW X=x1 Y=y1;
   DRAW X=x2 Y=y2;
   ...more DRAW statements...
   DRAW X=Xn Y=Yn;
ENDPOLYLINE;
Use a BEGINPOLYLINE
statement to open the block. In the BEGINPOLYLINE statement, use the
X= and Y= options to specify the coordinates of the beginning point
of the polyline. By default, the coordinate units are GRAPHPERCENT.
You can include the DRAWSPACE= option, or the XSPACE= and YSPACE=
options in options to specify
different units. If you specify the units as DATAVALUE and you want
to scale the polygon to the secondary axis, you must also include
the XAXIS=X2 and YAXIS=Y2 options. To change the line color, pattern,
or thickness, include the LINEATTRS= option.
Following the BEGINPOLYLINE
statement are the individual DRAW statements. Each DRAW statement
draws a straight line from the previous point to the endpoint that
is specified in the DRAW statement's X= and Y= options. For the first
DRAW statement, the previous point is the starting point that is specified
in the BEGINPOLYLINE statement. For subsequent DRAW statements, the
previous point is the endpoint that is specified in the previous DRAW
statement. Add a DRAW statement for each segment in your polyline.
You can add as many segments as you need. After the DRAW statements,
add an ENDPOLYLINE statement to close the block.
Here is an example that
draws a five-segment polyline beginning at the coordinates (30, 150).
The coordinates are specified in GRAPHPIXEL units.
beginpolyline x=30 y=150 / xspace=graphpixel yspace=graphpixel
   lineattrs=(thickness=1px);
   draw x=110 y=150; /* Draw S1 */
   draw x=145 y=250; /* Draw S2 */
   draw x=170 y=50;  /* Draw S3 */
   draw x=205 y=150; /* Draw S4 */
   draw x=285 y=150; /* Draw S5 */
endpolyline;
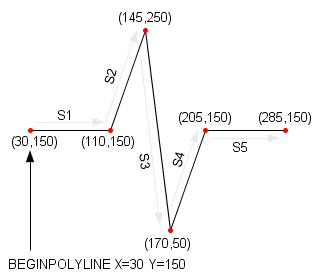
The X= and Y= options
in the BEGINPOLYLINE statement specify the starting point of the polyline,
(30, 150), in GRAPHPIXEL units. The first DRAW statement draws segment
1 (S1) between the starting point (30, 150) and endpoint (110, 150).
The second DRAW statement draws S2 between the endpoint (110, 150)
of the first DRAW statement to endpoint (145, 250). This pattern continues
for the remaining DRAW statements in the block. The ENDPOLYLINE statement
closes the block.
Polygons
BEGINPOLYGON X=origin-x Y=origin-y / <options>;
   DRAW X=x1 Y=y1;
   DRAW X=x2 Y=y2;
   ...more DRAW statements...
   DRAW X=origin-x Y=origin-y;
ENDPOLYGON;
Use a BEGINPOLYGON statement
to open the block. In the BEGINPOLYGON statement, use the X= and Y=
options to specify the coordinates of the beginning point of the polygon.
By default, the coordinate units are GRAPHPERCENT. You can include
the DRAWSPACE= option, or the XSPACE= and YSPACE= options in options to specify different units. If you specify
the units as DATAVALUE and you want to scale the polygon to the secondary
axis, you must also include the XAXIS=X2 and YAXIS=Y2 options. To
change the line color, pattern, or thickness, include the LINEATTRS=
option.
Following the BEGINPOLYGON
statement are the DRAW statements. Each DRAW statement draws a straight
line from the previous point to the endpoint that is specified in
the DRAW statement's X= and Y= options. For the first DRAW statement,
the previous point is the starting point that is specified in the
BEGINPOLYGON statement. For subsequent DRAW statements, the previous
point is the endpoint that is specified in the previous DRAW statement.
Add a DRAW statement for each side of your polygon. You can add as
many sides as you need. The last DRAW statement typically ends at
the starting point of the polygon in order to close the polygon.
Note: If the last DRAW statement
does not end at the starting point of the polygon, a line is drawn
automatically that connects the endpoint of the last DRAW statement
to the starting point in order to close the polygon.
Here is an example that
draws a four-sided polygon that begins at the coordinates (40, 100).
All of the coordinates are specified in GRAPHPIXEL units.
beginpolygon x=40 y=100 / xspace=graphpixel yspace=graphpixel
   display=all fillattrs=(color=lightgray)
   outlineattrs=(thickness=1px pattern=shortdash color=blue);
   draw x=30  y=220; /* Draw S1 */
   draw x=160 y=200; /* Draw S2 */
   draw x=180 y=80;  /* Draw S3 */
   draw x=40  y=100; /* Draw S4 */
endpolygon;
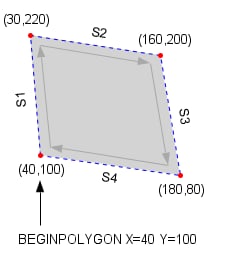
The BEGINPOLYGON statement
X= and Y= options specify the starting point of the polygon, (40,
100). The DISPLAY=ALL option displays the outline and fill. The FILLATTRS=
option specifies a light gray fill, while the OUTLINEATTRS= option
specifies a dashed blue outline. The first DRAW statement draws side
1 (S1) between the starting point (40, 100) and endpoint (30, 220).
The second DRAW statement draws S2 between endpoint (30, 220) of the
first DRAW statement to endpoint (160, 200). This pattern continues
for the remaining DRAW statements. The last DRAW statement connects
endpoint (180, 80) to the starting point, (40, 100), which closes
the polygon. The ENDPOLYGON statement closes the block.
Adding Images
The image file is specified
as image-file.ext, which is
an absolute or relative path to the image file on the file system.
The path must be enclosed in quotes, and it must include the image
filename and file extension, such as image.jpg or image.png.
The X= and Y= options
in the DRAWIMAGE statement specify the coordinates of the image anchor
point. By default, the coordinate units are GRAPHPERCENT, and the
image is anchored on its center point. You can include the DRAWSPACE=
option, or the XSPACE= and YSPACE= options in options to specify different units. If you choose
DATAVALUE as the units and you want to scale the image to the secondary
axis, you must also include the XAXIS=X2 and YAXIS=Y2 options. You
can include the ANCHOR= option to change the anchor point.
You can use the HEIGHT=
and WIDTH= options in the DRAWIMAGE statement to create a bounding
box in which the image is drawn. The default units for the height
and width are PERCENT. You can include the SIZEUNIT= option in options to specify PIXEL or DATA units instead.
You can also include the SCALE= option to specify how the image is
scaled within the bounding box. By default, the image is scaled to
fit the box. You can also fit the image by height or width, or you
can tile the image. If you want to draw a border around your image,
you can include the BORDER=Y and BORDERATTRS= options.
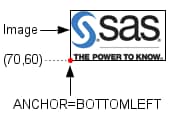
Here is an example that
adds the SAS logo at coordinates (70, 60) in GRAPHPIXEL units. The
image is anchored at the bottom left corner, and a black border is
drawn around the image.