Text Strings in Graphs
Using the GTL, you can add
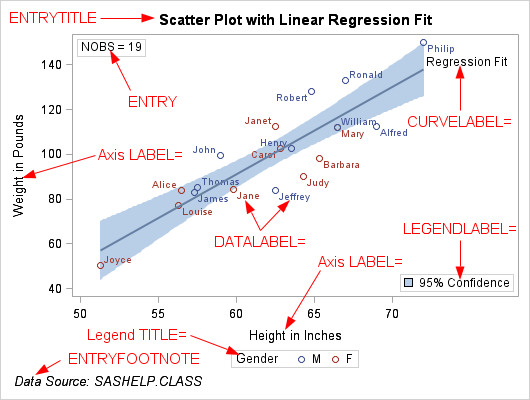
and control text that appears in your graph. The annotation in the
following diagram indicates some of the options and statements that
are used to set the text in a typical graph.
The following options,
available on plot and legend statements, manage most of the text that
you can add to a graph:
The GTL also provides
the following text statements that can be used to add custom information
about the graph analysis or the graph display. This text is independent
of the text that is managed by the options on plot and legend statements:
This chapter focuses
primarily on how to set text properties for any text. Additional information
about text-related features for axes, legends, insets, and multi-cell
layouts is available in other chapters:
-
For managing the text in axes, see Managing Axes in an OVERLAY Layout.
-
For managing the text in legends, see Adding Legends to a Graph.
-
For managing the text in insets, see Adding Insets to a Graph.
-
For managing the text in multi-cell layouts, see Using an Advanced Multi-cell Layout and Using Classification Panels.