LOG Axes
Overview of LOG Axes
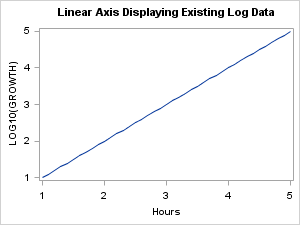
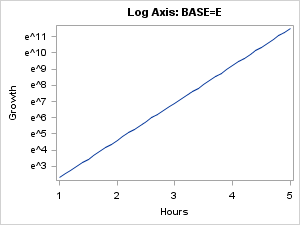
An axis displaying a
logarithmic scale is very useful when your data values span orders
of magnitude. For example, when you plot your growth data with a
linear axis, you suspect that the growth rate is exponential.
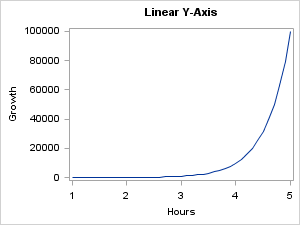
To confirm this, you can request
a log axis, which is never drawn by default. Instead, you must request
it with the TYPE=LOG axis option. Any of the four axes can be a log
axis.
layout overlay / yaxisopts=(type=log);
Setting the Tick Intervals
Log axes support the
TICKINTERVALSTYLE= option, which provides different styles for displaying
tick values:
A LOGEXPAND, LOGEXPONENT,
or LINEAR representation is chosen automatically, based on the range
of the data. When the data range is small (within an order of magnitude),
a LINEAR representation is typically used. Data ranges that encompass
several orders of magnitude typically use the LOGEXPAND or LOGEXPONENT
representation. AUTO is the default.
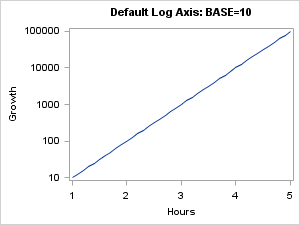
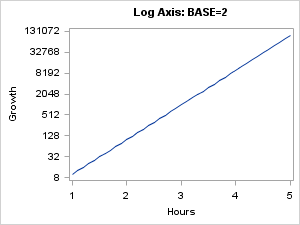
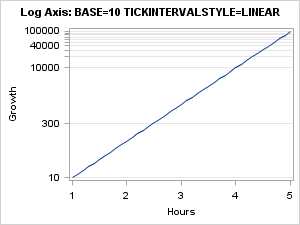
Major ticks are placed
at uniform intervals at integer powers of the base. By default, a
BEST6. format is applied to BASE=10 and BASE=2 tick values. This means
that, depending on the range of data values, you might see very large
or very small values written in exponential notation (10E6 instead
of 1000000). The preceding examples with a log axis show TICKINTERVALSYTLE=LOGEXPAND.
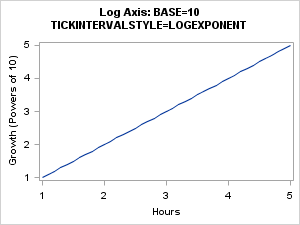
When using TICKINTERVALSTYLE=LOGEXPONENT,
it might not be clear what base is being used. You should consider
adding information to the axis label to clarify the situation:
layout overlay / yaxisopts=(type=log label="Growth (Powers of 10)"
  logopts=(base=10 tickintervalstyle=logexponent));
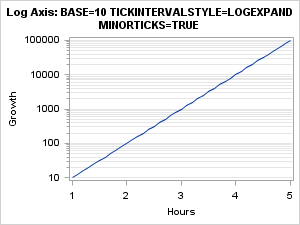
When using BASE=10 and
TICKINTERVALSTYLE=LOGEXPAND or TICKINTERVALSTYLE=LOGEXPONENT, you
can add minor ticks to emphasize the log scale:
layout overlay / yaxisopts=(type=log griddisplay=on
  logopts=(base=10 tickintervalstyle=linear minorticks=true ));
As with LINEAR and TIME
axes, the data range of a log axis can be set with the VIEWMIN= and
VIEWMAX= log options.