Selecting the Drawing Space and Units
When you draw graphics elements,
you can specify the drawing space and the drawing units in your draw
statements. The drawing space is the area of the graph in which the
elements are drawn, which can be data, wall, layout, or graph. The
drawing areas are described in the following table.
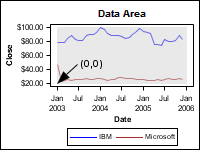
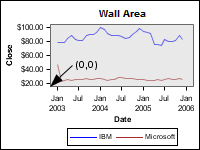
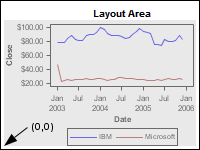
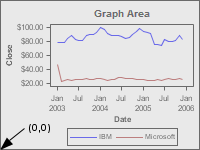
DrawingSpace can be DATA, WALL, LAYOUT, or GRAPH. For the WALL, LAYOUT, and GRAPH
areas, Units can be PIXEL or
PERCENT. For the DATA drawing space, Units can be PIXEL, PERCENT, or VALUE. PIXEL indicates that the coordinates
are expressed in pixels in the drawing space. PERCENT indicates that
the coordinates are expressed as a percentage of the drawing space.
For example, DATAPERCENT indicates that the coordinates are expressed
as a percentage of the DATA drawing space.
For the DATA drawing
space, VALUE indicates that the coordinates are expressed as values
along the axis. When you specify the DATA drawing space, you can use
the XAXIS=, YAXIS=, X1AXIS=, Y1AXIS=, X2AXIS=, and Y2AXIS= options
in the draw statement, as applicable, to specify the axis to which
the coordinates are scaled.
Note: A
draw statement is discarded if the XAXIS=, YAXIS=, X1AXIS=, Y1AXIS=,
X2AXIS=, and Y2AXIS= options specify an axis that does not exist in
the plot. It is also discarded if the DRAWSPACE=, XSPACE=, YSPACE=,
X1SPACE=, Y1SPACE=, X2SPACE=, and Y2SPACE= options specify a drawing
space that is not valid for the draw statement's layout container.
You can specify a common drawing space
and units for all of the X and Y coordinates. You can also specify
a different drawing space and units for the coordinates individually.
To specify a common space and units, use the DRAWSPACE= option on
each draw statement or in the BEGINGRAPH statement. When you use the
DRAWSPACE= option on a draw statement, the space and units that you
specify are applied to the coordinates for that statement only. This
includes the X and Y coordinates or the X1, Y1, X2, and Y2 coordinates.
When you use the DRAWSPACE= option in the BEGINGRAPH statement, the
space and units that you specify are applied to all of the draw statements
within the BEGINGRAPH/ENDGRAPH block.