Axis Line versus Wall Outline
The area
bounded by the X, Y, X2, and Y2 axes is called the Wall Area or simply
the Wall. The wall consists of a filled area (FILL) and a boundary
line (OUTLINE). The display of the Wall is independent of the display
of axes. When both are displayed, the axes are placed on top of the
wall outline. Most frequently, your plots will use only the X and
Y axes, not X2 or Y2.
By default, you will see lines that look like X2 and
Y2 axis lines, but they are not axis lines. They are the lines of
the wall outline, which happens to be the same color and thickness
as the axis lines. This can be made apparent by assigning different
visual properties to the wall outline and the axis lines.
The GraphAxisLines
style element controls the appearance of all axis lines, and the GraphWalls
style element controls the wall. The following example shows how you
can change the appearance of the axes and wall with a style definition.
In the template code, the PROC TEMPLATE block defines a style named
AXIS_WALL, and then the ODS LISTING statements sets the AXIS_WALL
style as the active style for output that is directed to the LISTING
destination:
proc template ;
 define style axis_wall;
 parent=styles.listing;
 style graphwalls from graphwalls /
   frameborder=on
   linestyle=1
   linethickness=2px
   backgroundcolor=GraphColors("gwalls")
   contrastcolor= orange;
 style graphaxislines from graphaxislines /
   linestyle=1
   linethickness=2px
   contrastcolor=blue;
 end;
run;

ods listing style=axis_wall ;
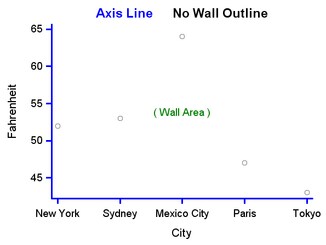
If a simple
GTL template containing the following layout block is executed while
the AXIS_WALL style is in effect, you would be able to see that the
axis lines are distinct from the wall outlines:
layout overlay / walldisplay=(fill outline); /* default walldisplay */
  scatterplot  x=City y=Fahrenheit / datatransparency=.5;
  entry textattrs=(color=green) "( Wall Area )";
endlayout;
Most styles
set the axis lines and the wall outline to be the same color, line
pattern, and thickness, so it is impossible to see the difference.
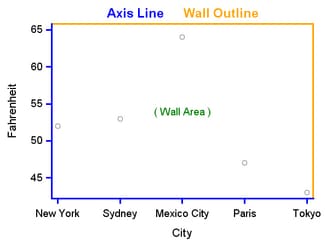
Sometimes you might not want to see the wall outline, or you might
want to change the wall color. These types of changes can be set on
a style or with the WALLDISPLAY= option on the LAYOUT OVERLAY statement.
For example, the GTL default for the wall is WALLDISPLAY=(FILL OUTLINE).
The following code fragment
shows how to use the style definition to turn off the wall outline:
	style GraphWalls from GraphWalls /
	   frameborder=off;