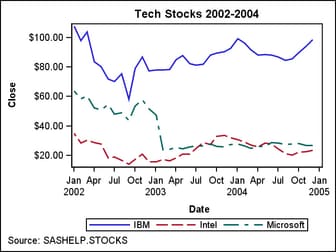
Appearance of Grouped Data
The GROUP= column option is used to plot data when a classification
or grouping variable is available. By default, this option automatically
uses the style elements GraphData1 to GraphDataN for the presentation
of each unique group value.
proc template;
  define statgraph group;
    begingraph;
      entrytitle "Tech Stocks 2002-2004";
      entryfootnote halign=left "Source: SASHELP.STOCKS";
      layout overlay;
        seriesplot x=date y=close / group=stock name="series"
          lineattrs=(thickness=2);
        discretelegend "series";
      endlayout;
    endgraph;
  end;
run;

proc sgrender data=sashelp.stocks template=group;
  where date between "1jan02"d and "31dec04"d;
run;
In general,
you cannot specify the line or marker properties for specific group
values directly from GTL, as you can for non-grouped data. Consider
the following specification for a line attribute:
lineattrs=(thickness=2)
When this
line option is used, the line thickness is set as a style override.
However, this override applies equally to all group values. The same
is true for overrides of color or line pattern. This means that you
can set one or more fixed appearance attributes from GTL for all group
values, but you cannot directly assign unique visual properties to
an individual group value in GTL.
