Positioning an Inset
If a table
of text is used as an inset within a 2D overlay-type layout, you can
position the table within the parent layout with options on the LAYOUT
GRIDDED statement. You can use the AUTOALIGN= option to automatically
position the inset to avoid collision with scatter points, lines,
bars, and other plot components.
Alternatively, you can use the HALIGN= and VALIGN= options
to position the table absolutely. The combined values provide nine
possible fixed positions. The disadvantage of using the HALIGN= and
VALIGN= options is that they do not attempt to avoid collision with
other plot components.
The following
example uses the AUTOALIGN= option to restrict the table position
to one of the upper corners of the plot wall.
proc template;
define statgraph  ginset3a;
 begingraph;
  entrytitle "Auto-positioning the Inset Within the Plot Wall";
  layout overlay;
   histogram mrw;
   layout gridded / columns=1 border=true autoalign=(topleft topright) ;
     entry  halign=left "N"       halign=right "5203";
     entry  halign=left "Mean"    halign=right "119.96";
     entry  halign=left "Std Dev" halign=right "19.98";
   endlayout;
  endlayout;
 endgraph;
end;
run;

proc sgrender data=sashelp.heart template=ginset3a;
run;
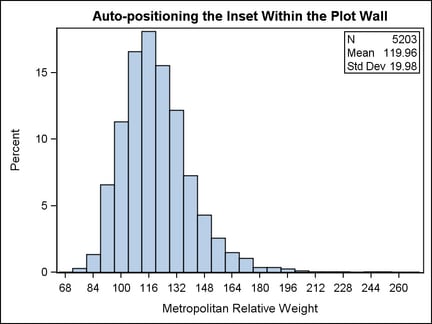
In this
particular case there was not enough space to display the inset in
the top left position, so the next position was used because it has
no collision. With a different set of data, the inset might appear
in the top left position. If both positions resulted in a collision,
the position with the least collision would be used. You can specify
an ordered list of up to nine positions for the AUTOALIGN list: TOPLEFT,
TOP, TOPRIGHT, LEFT, CENTER, RIGHT, BOTTOMLEFT, BOTTOM, and BOTTOMRIGHT.
For a scatter plot where "open" space is not predictable, you can
specify AUTOALIGN=AUTO, which selects a position that minimizes collision
with the scatter markers.
Note: The AUTO setting
for the AUTOALIGN= option works best when the layout contains only
scatter plots. When other plot types are present, the ENTRY text might
overlap a graphic element in the plot area.
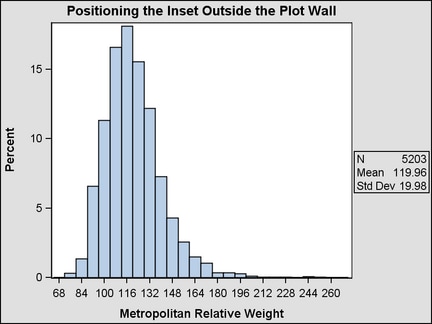
Outside Insets. An inset does
not have to be placed inside the plot wall. This next example positions
an inset in the sidebar of a LATTICE layout.
proc template;
 define statgraph  ginset3b;
  begingraph / pad=2px;
    entrytitle "Positioning the Inset Outside the Plot Wall";
    layout lattice;
      layout overlay;
        histogram mrw;
      endlayout;
      sidebar / align=right;
        layout overlay / pad=(left=2px);
          layout gridded / columns=1  border=true;
            entry  halign=left "N"       halign=right "5203";
            entry  halign=left "Mean"    halign=right "119.96";
            entry  halign=left "Std Dev" halign=right "19.98";
          endlayout;
	        endlayout;
      endsidebar;
    endlayout;
  endgraph;
 end;
run;

ods listing style=default;
proc sgrender data=sashelp.heart template=ginset3b;
run;
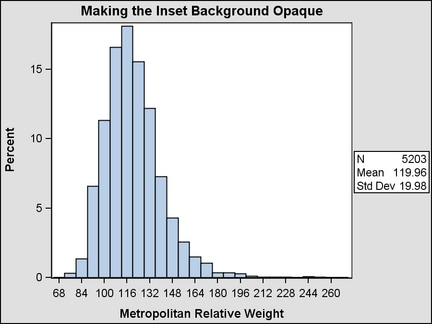
By default, the background of ENTRY statements and a
GRIDDED layout are transparent. So if the current style defines a
background color and the inset does not appear in the plot wall, the
style's background color will be seen through the inset. You can make
the background of the insert opaque and set its background color to
match the plot wall color, as shown in the following code fragment:
sidebar / align=right;
  layout overlay / pad=(left=2px);
    layout gridded / columns=1  border=true
           opaque=true  backgroundcolor=graphWalls:color ;
      entry  halign=left "N"       halign=right "5203";
      entry  halign=left "Mean"    halign=right "119.96";
      entry  halign=left "Std Dev" halign=right "19.98";
    endlayout;
  endlayout;
endsidebar;