The LAYOUT OVERLAY3D Statement
GTL has
one layout for 3D graphics: the LAYOUT OVERLAY3D statement. Two 3D
plot statements can be placed within this layout: BIHISTO3DPARM and
SURFACEPLOTPARM. No 2D plot statements can be used in this layout,
although text statements such as ENTRY can be used.
Typical
applications of OVERLAY3D layout are to create a 3D representation
of a surface or a bi-variate histogram (possibly overlaid together).
The 3D layout has features that 2D layouts do not have. For example,
it can do each of the following:
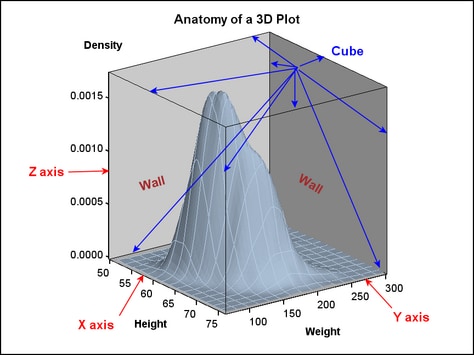
The following figure shows the basic anatomy of a
3D graph: