Example 1: Create an Arrow in a Paneled Graph
| Features: |
ARROW |
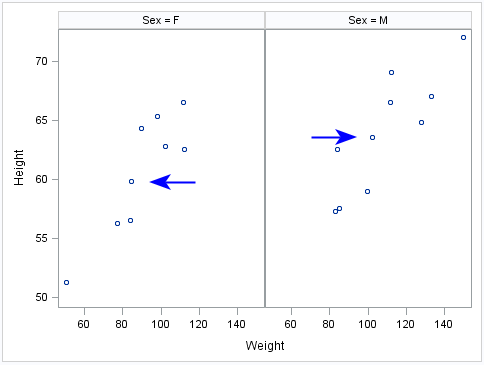
This example
uses the SGPANEL procedure to create an arrow near the middle data
point for the height variable in each panel.
Program
data annoArrow;
retain drawspace "layoutpercent" linecolor "blue";
input function $ x1 y1 x2 y2 shape $ direction $;
datalines;
arrow 30 50 40 50 barbed in
arrow 65 63 75 63 barbed out
;
run;
proc sgpanel data=sashelp.class sganno=annoArrow;
panelby sex;
scatter x=weight y=height;
run;