Rendering Graphs from GTL Templates or ODS Graphics Editor Files
The SGRENDER procedure creates graphical output from
templates that are created using the Graph Template Language (GTL).
You can use the GTL to create many different types of plots, paneled
graphs, and matrices, some of which cannot be created with the ODS
Graphics procedures.
The SGRENDER procedure
can also produce graphical output from graphs that were edited in
the SAS ODS Graphics Editor. An ODS Graphics Editor file (SGE) is
created in SAS by using the SGE = ON option in the ODS destination
statement. The SGRENDER procedure enables you to run one or more graphs
in batch mode and render the graphs to any ODS destination using any
of the supported ODS options. For more information about the editor,
see the SAS ODS Graphics Editor: User's Guide.
The following example
shows a layout that you can create by using the GTL and the SGRENDER
procedure.
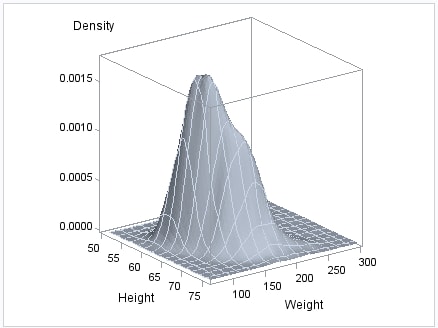
proc template;
  define statgraph surface;
  begingraph;
     layout overlay3d;
      surfaceplotparm x=height y=weight z=density;
     endlayout;
  endgraph;
  end;
run;

proc sgrender data=sashelp.gridded template=surface;
run;
For more
information about the SGRENDER procedure, see SGRENDER Procedure. For more information about the GTL, see SAS Graph Template Language: User's Guide.