Using Procedure Options to Control Graph Appearance
Overview of the Appearance Options
ODS styles enable you to control the overall appearance
of the graphs. The ODS Graphics procedures also enable you to control
the appearance of particular graphics elements in a graph. Graphics
elements include lines, bars, markers, text, and so on.
Many ODS Graphics procedure
statements have options and suboptions that control the appearance
of different parts of a graph. Default visual attributes of various
graphics elements are derived from the specific style elements of
the active style. By using appearance options in your procedure statements,
you can change the appearance of one or more aspects of your graph
without changing the overall style.
For example, the following
statement specifies that the mean value confidence limits (for a regression
plot) use the GraphConfidence2 style element instead of the default
GraphConfidence style element:
reg x=height y=weight / clmattrs=GraphConfidence2;-
density height / lineattrs=(pattern=dashdashdot color=red);
This method overrides one or more attributes of the style element. See Specifying Hardcoded Values.
Specifying a Style Element
You can change the visual
attributes that are used for a graphics element by specifying a particular
style element for any appearance option. Graphics elements include
lines, bars, markers, text, and so on.
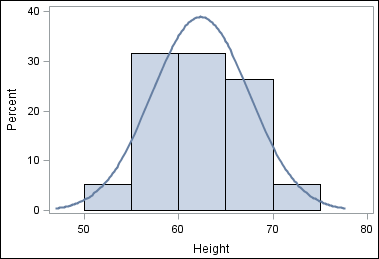
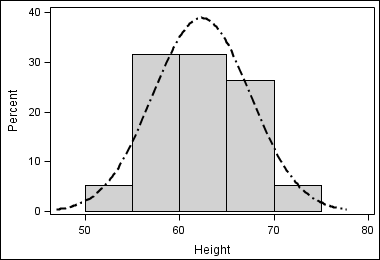
For example, the graph
shown here is a histogram with a normal density curve. By default,
the visual attributes of the density curve are specified by the style
attributes within the style element GraphFit.
Histogram with Density Curve That Uses the Default Style Element
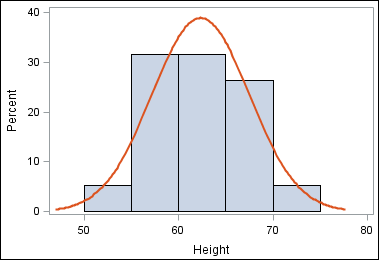
You can use the LINEATTRS=
option in the DENSITY statement to change the style element that is
used for the line attributes. For example, when you are using the
HTMLBlue style, specifying the GraphFit2 style element changes the
density curve line to an orange color.
density height / lineattrs=graphfit2;
Specifying a style element
is the preferred way to change the appearance of a graphics element.
Visual attributes that are referenced by the style element are chosen
to provide consistency and appropriate emphasis based on display principles
for statistical graphics. If you later change the style for the graph,
the graphics element is compatible with the new style.
Specifying Hardcoded Values
In some cases it is important to have
a specific visual effect, but it is not necessary for the plot to
be reused with different styles. In such a case, you can specify hardcoded
values for the visual attributes in the appearance option.

In general, it is recommended
that you specify the style element rather than hardcoded values. Style
elements are designed to derive all of the relevant visual attributes
from the applied style. When you specify a hardcoded value for the
line color, as in this example, the color is no longer derived from
the specified style element. If you later change the style that is
applied to the graph, the hardcoded attribute might conflict with
the new style. Also, a hardcoded color could be exactly the same color
as the wall color of another style, and become indistinguishable from
the wall.
For example, if you
change the overall style to Journal, which only uses gray-scale colors,
the color for the curve is still red. This result might not be desirable.
You use a standard syntax
to hardcode colors, line thickness, line patterns, and marker symbols.
-
Specifying Colors in SAS/GRAPH Programs in SAS/GRAPH: Reference
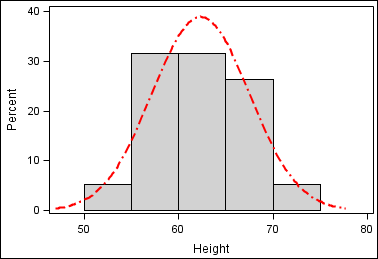
Specifying a Style Element with Hardcoded Values
You can specify a style
element, but override one or more attributes of that style element
with hardcoded values.
This example modifies
a density curve. The example specifies the GraphFit2 style element
for line attributes, but also specifies a particular line pattern
with a hardcoded value.
density height / lineattrs=graphfit2 (pattern=dashdashdot);
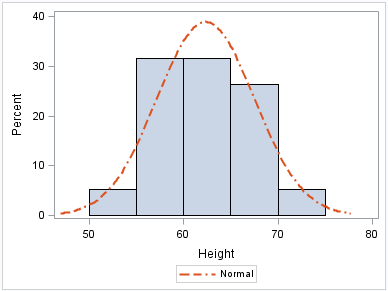
If you change the overall
style to Journal, the color for this curve changes as well. However,
the pattern remains DashDashDot because it was hardcoded.
Always be careful when
you hardcode a value. When you specify a hardcoded value for the line
pattern, as in this example, the pattern is no longer derived from
the specified style element. If you later change the style that is
applied to the graph, the hardcoded attribute might conflict with
the new style.