Creating Multi-Cell Graphs
The SGPANEL
procedure creates a panel for the values of one or more classification
variables. Each graph cell in the panel can contain either a single
plot or multiple overlaid plots.
The SGPANEL procedure
supports most of the plots and overlays that the SGPLOT procedure
supports. For this reason, the two procedures have an almost identical
syntax. As with the SGPLOT procedure, options are available for specifying
colors, marker symbols, and other attributes.
The procedure syntax
supports four types of panel layouts: PANEL, LATTICE, COLUMNLATTICE,
and ROWLATTICE.
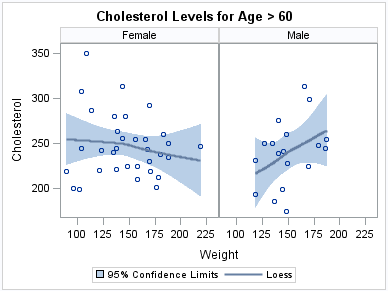
The following example
creates a panel of loess curves using the default PANEL layout. In
the PANEL layout, each graph cell represents a specific crossing of
values for one or more classification variables. A label above each
cell identifies the crossing of values that is represented in the
cell. By default, cells are created only for crossings that are represented
in the data set.
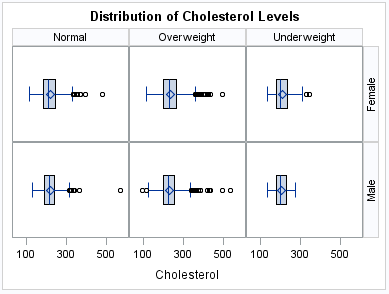
The following example
creates a panel of box plots in a LATTICE layout. The graph cells
are arranged in rows and columns by using the values of two classification
variables. Labels above each column and to the right of each row identify
the classification value that is represented by that row or column.
A cell is created for each crossing of classification values.
For more information
about the SGPANEL procedure and the procedure syntax, see SGPANEL Procedure.