Example
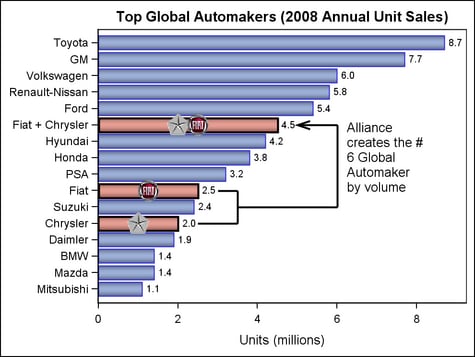
The following example
shows a bar chart of the top global automobile makers in 2008. To
focus the graph on the 2008 merger between Chrysler and Fiat, the
example uses DRAWRECTANGLE and DRAWIMAGE statements to highlight the
three bars in the chart that correspond to the unit sales for the
two auto makers. The example also uses a DRAWARROW statement and two
BEGINPOLYLINE blocks to point to the sales figures, and it uses a
DRAWTEXT statement to explain the implications of the merger.
All of the draw statements
in this example use the data space (see About the Drawing Space and Drawing Units) to integrate the drawn elements into the
graph’s data area.
/* Create Data for Chrysler, Fiat and Chriysler+Fiat widths */
data mydata;
 length automaker $30;
 input automaker $ 1-30 million_units;
 FORMAT million_units 3.1;

 if index(automaker,'Chrysler')^=0 or index(automaker,'Fiat')^=0 then
    colorvar=1;
 else
   colorvar=2;

 if index(automaker,'Chrysler')^=0 and index(automaker,'Fiat')^=0 then
   do;
      call symput("cfwidth",  million_units);
   end;
 else if index(automaker,'Fiat')^=0 then
   do;
      call symput("fwidth",  million_units);
   end;
 else if  index(automaker,'Chrysler')^=0 then
   do;
      call symput("cwidth",  million_units);
   end;

datalines;
Toyota                         8.7
GM                             7.7
Volkswagen                     6.0
Renault-Nissan                 5.8
Ford                           5.4
Fiat + Chrysler                4.5
Hyundai                        4.2
Honda                          3.8
PSA                            3.2
Fiat                           2.5
Suzuki                         2.4
Chrysler                       2.0
Daimler                        1.9
BMW                            1.4
   Mazda                          1.4
Mitsubishi                     1.1
;
/* Create template definition */
proc template;
 define statgraph automerger;
 begingraph /  drawspace=datavalue;
   entrytitle halign=center
     'Top Global Automakers (2008 Annual Unit Sales)';
   layout lattice / rowdatarange=data columndatarange=data
         rowgutter=10 columngutter=10;
     layout overlay / xaxisopts=(label=('Units (millions)'))
         yaxisopts=(reverse=true display=(ticks tickvalues line));
       barchart x=automaker y=million_units / group=colorvar
         name='bar(h)' barlabel=true dataskin=pressed orient=horizontal;
       drawrectangle x=eval(&cwidth/2.0) y="Chrysler"
         width=&cwidth height=0.85 / widthunit=data heightunit=data
         display=(outline) outlineattrs=(color=black) ;
       drawrectangle x=eval(&fwidth/2.0) y="Fiat"
         width=&fwidth height=0.85 /
         widthunit=data heightunit=data
         display=(outline) outlineattrs=(color=black) ;
       drawrectangle x=eval(&cfwidth/2.0) y="Fiat + Chrysler"
         width=&cfwidth height=0.85 / widthunit=data heightunit=data
         display=(outline) outlineattrs=(color=black) ;
       drawimage "C:\chrysler_logo.png" /
         x=eval(&cwidth/2.0) y="Chrysler" ;
       drawimage "C:\fiat_logo.png" /
         x=eval(&fwidth/2.0) y="Fiat" ;
       drawimage "C:\chrysler_logo.png" /
         x=eval(&cfwidth/2.0 - 0.25) y="Fiat + Chrysler" ;
       drawimage "C:\fiat_logo.png" /
         x=eval(&cfwidth/2.0 + 0.25) y="Fiat + Chrysler" ;
       beginpolyline x=eval(&cwidth + 0.5) y="Chrysler" ;
         draw x=eval(&cwidth + 1.5) y="Chrysler" ;
         draw x=eval(&cwidth + 1.5)  y="Fiat" ;
         draw x=eval(&cwidth + 0.5)  y="Fiat" ;
       endpolyline ;
       beginpolyline x=eval(&cwidth + 1.5)  y="Suzuki" ;
         draw x=eval(&cfwidth + 1.5)  y="Suzuki" ;
         draw x=eval(&cfwidth  + 1.5) y="Fiat + Chrysler" ;
       endpolyline ;
       drawarrow x1=eval(&cfwidth + 1.5) x2=eval(&cfwidth + 0.5)
         y1="Fiat + Chrysler" y2="Fiat + Chrysler" ;
       drawtext "Alliance creates the #6 Global Automaker by volume" /
         y="Honda" x=eval(&cfwidth+2.5) width=2 widthunit=data ;
     endlayout;
   endlayout;
 endgraph;
end;

proc sgrender data=mydata template=automerger;
run;