Axes
The GTL uses various
criteria to determine the displayed axis features for a graph. Generally,
axis features are based on the layout type, the order of plot statements
in the layout and the options specified on those statements, the use
of “primary” and “secondary” axes on the
plots (when secondary axes are supported), the plot type, the column(s)
of data that contribute to defining the axis range, and the data formats
for the contributing data columns.
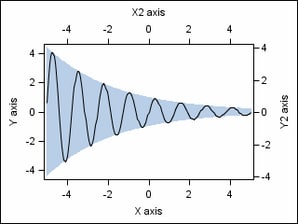
Depending on the layout
type, 2-D plots can have up to four independent axes that can be displayed:
X, Y, X2, and Y2. The X and Y axes are considered the primary axes,
and the X2 and Y2 axes are considered the secondary axes. By default,
the X2 and Y2 axes are not displayed. When requested, the secondary
axes can be displayed as copies of the primary axes, or data can be
mapped separately to them. The following figure identifies the X,
Y, X2, and Y2 axes.
For more information
about axis features in GTL, see Axis Features in Layouts.