Output
When using the GTL, you focus primarily on defining
template definitions that produce specific graphs and generate a particular
output layout. Ultimately, you must also tailor the graphical environment
to get the exact output that you desire. The ODS GRAPHICS statement
is available for tailoring the graphical environment, and ODS styles
enable you to manage the output appearance.
ODS GRAPHICS Statement
The ODS GRAPHICS statement
is used to modify the environment in which graphics templates are
executed. The ODS GRAPHICS statement is used to control
ODS Styles
When any graphics template
is executed, there is always an ODS style in effect that governs the
appearance of the output. The following ODS statement sends graphics
output to the RTF output destination using the LISTING style:
ods rtf style=listing;

ods graphics on / height=175px width=200px border=off;
 proc sgrender data=sashelp.class
               template=scatter;
   run;
ods graphics off;

ods rtf close;
Support for ODS styles
is highly integrated into GTL syntax. By default, the graphical appearance
features of most plot and text statements are mapped to corresponding
style elements and associated attributes. Because of this, your output
tables and graphs always have a reasonable overall appearance. Moreover,
output for a given ODS destination has a consistent look (for example,
table colors and graph colors don’t clash).
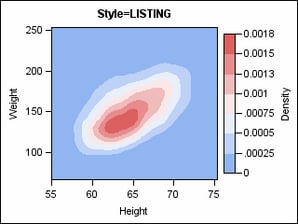
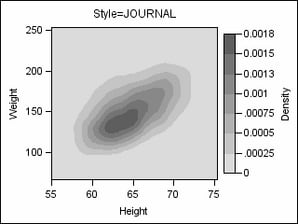
The following figures
show how a graph’s appearance can be changed by using references
to style elements to set the graph’s appearance options. This
technique permits changes in graph appearance by style modification
instead of graphical template modification. The graphs in the figures
are generated with the following GTL statement:
contourplotparm x=x y=y z=density /
  contourtype=fill nhint=9
  colormodel=ThreeColorRamp ;