Working with Plot Properties
The Plot Properties Dialog Box
You can modify all of
the properties of the plots and axes that are in a cell by using the Plot Properties dialog box.
To open the Plot Properties dialog box, right-click in a plot and
select Plot Properties. You can also click
in the plot area and then select Format Plot Properties from the main
menu.
Plot Properties from the main
menu.
Plot Properties
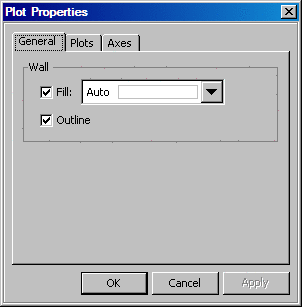
About Plot Properties
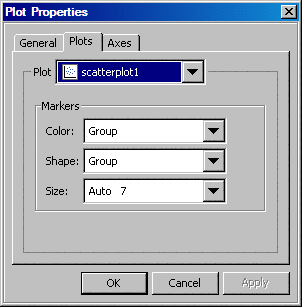
In the Plots tab, you can modify the properties of individual plots. If more
than one plot is open, then you can select the plot that you want
to modify from the Plot list box.
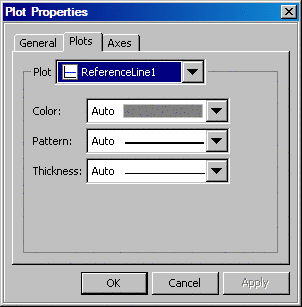
Marker and Line Properties
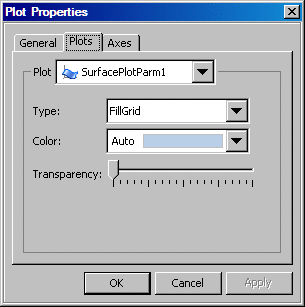
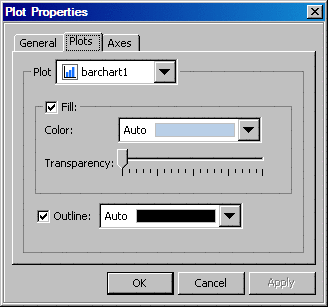
Fill and Outline Properties
Plots such as bar charts
and histograms use graphical elements that have a fill color. The Fill check box is selected by default. If you specify
an outline for the plot, then you can clear the Fill check box.
When the Fill check box is selected, then you can specify the
fill color and the transparency. Moving the slider to the right makes
the fill color more transparent. (The other part of the plots, such
as its outline, do not change.) The default value for transparency
is obtained from the plot definition.
Note: The editor modifies graphics
elements that have fill attributes, but does not manipulate data transparency.
Therefore, transparency is not applied to lines, text, and markers.
In addition, if data transparency has been defined in the graph, then
specifying a fill transparency causes the data transparency to be
ignored.
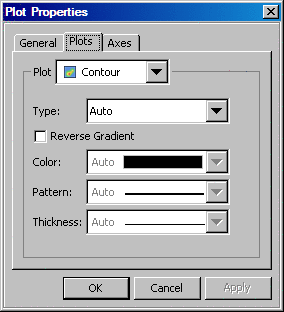
Contour Properties
Contour has different
graphical elements, such as lines, labels, fill, and gradient based
on the contour type. You can change the contour type.
If the contour plot
includes an area, such as a fill or gradient, then the color can be
reversed by selecting the Reverse Gradient check box.