About the Linear Regression for Sports Cars Example

The linear regression 
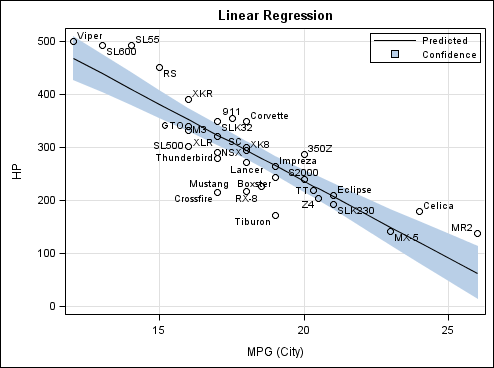
example shows the relationship between miles per gallon and horsepower for a number of sports cars. In this example, you are interested in the cars that fall outside of the confidence band. However, the labels in the middle portion of the graph are cluttered together. It is not clear which label belongs to which observation.
Linear Regression Example with Many Labels
Your strategy is to show only a few of the data labels and hide the others. When you hide data labels, ODS Graphics Editor redraws the labels on the graph. This time, there is more space for the data labels of interest.
The code uses the REG procedure to create the linear regression and the SGPLOT procedure to create the graph.