For this example, select
all the observations that lie outside the confidence band:
-
Select the data label
icon

in the Graph toolbar.
-
Right-click the plot
and select
Hide All. Hiding the labels makes
it easier to see which data points to select.
-
Press CTRL and click
the observations that lie outside the confidence band. The selected
data points display in the selection color.
-
Right-click and choose
Show Only Selected from the menu. Labels appear next
to the data points that you selected.
-
Click inside the graph
again. The data points and their labels display in the normal graph
color. Only the data points that lie outside the confidence band have
labels.
-
Select
Format StyleListing
 from the main menu.
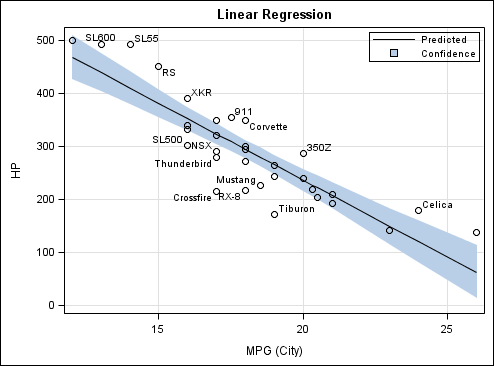
The revised example
is shown here:
Labels Show Only for Observations Outside the Confidence Band