About the Simple Graph

This example uses the Class data set in the SAS Help library. The example provides the height and weight of individual students in a class and uses the SGPLOT procedure to produce a scatter plot.
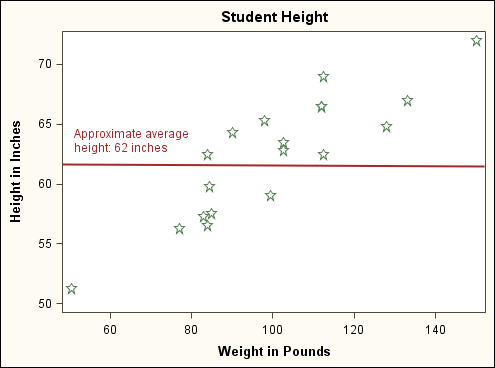
In this example, you edit the graph by adding a title and changing the axis labels. You also change the scatter plot markers, the graph style, and the graph size.
Edited and Annotated Simple Graph